Introduction
All the data from the Device linked to an Asset is captured and stored in the platform. This allows the User to see exactly what data was received during the day, a trip, including any analog, digital and other data. This data can be used to troubleshoot issue, create IO types and other data received (e.g. overspeeding events, harsh braking etc) can also be used in Asset Rating profiles.
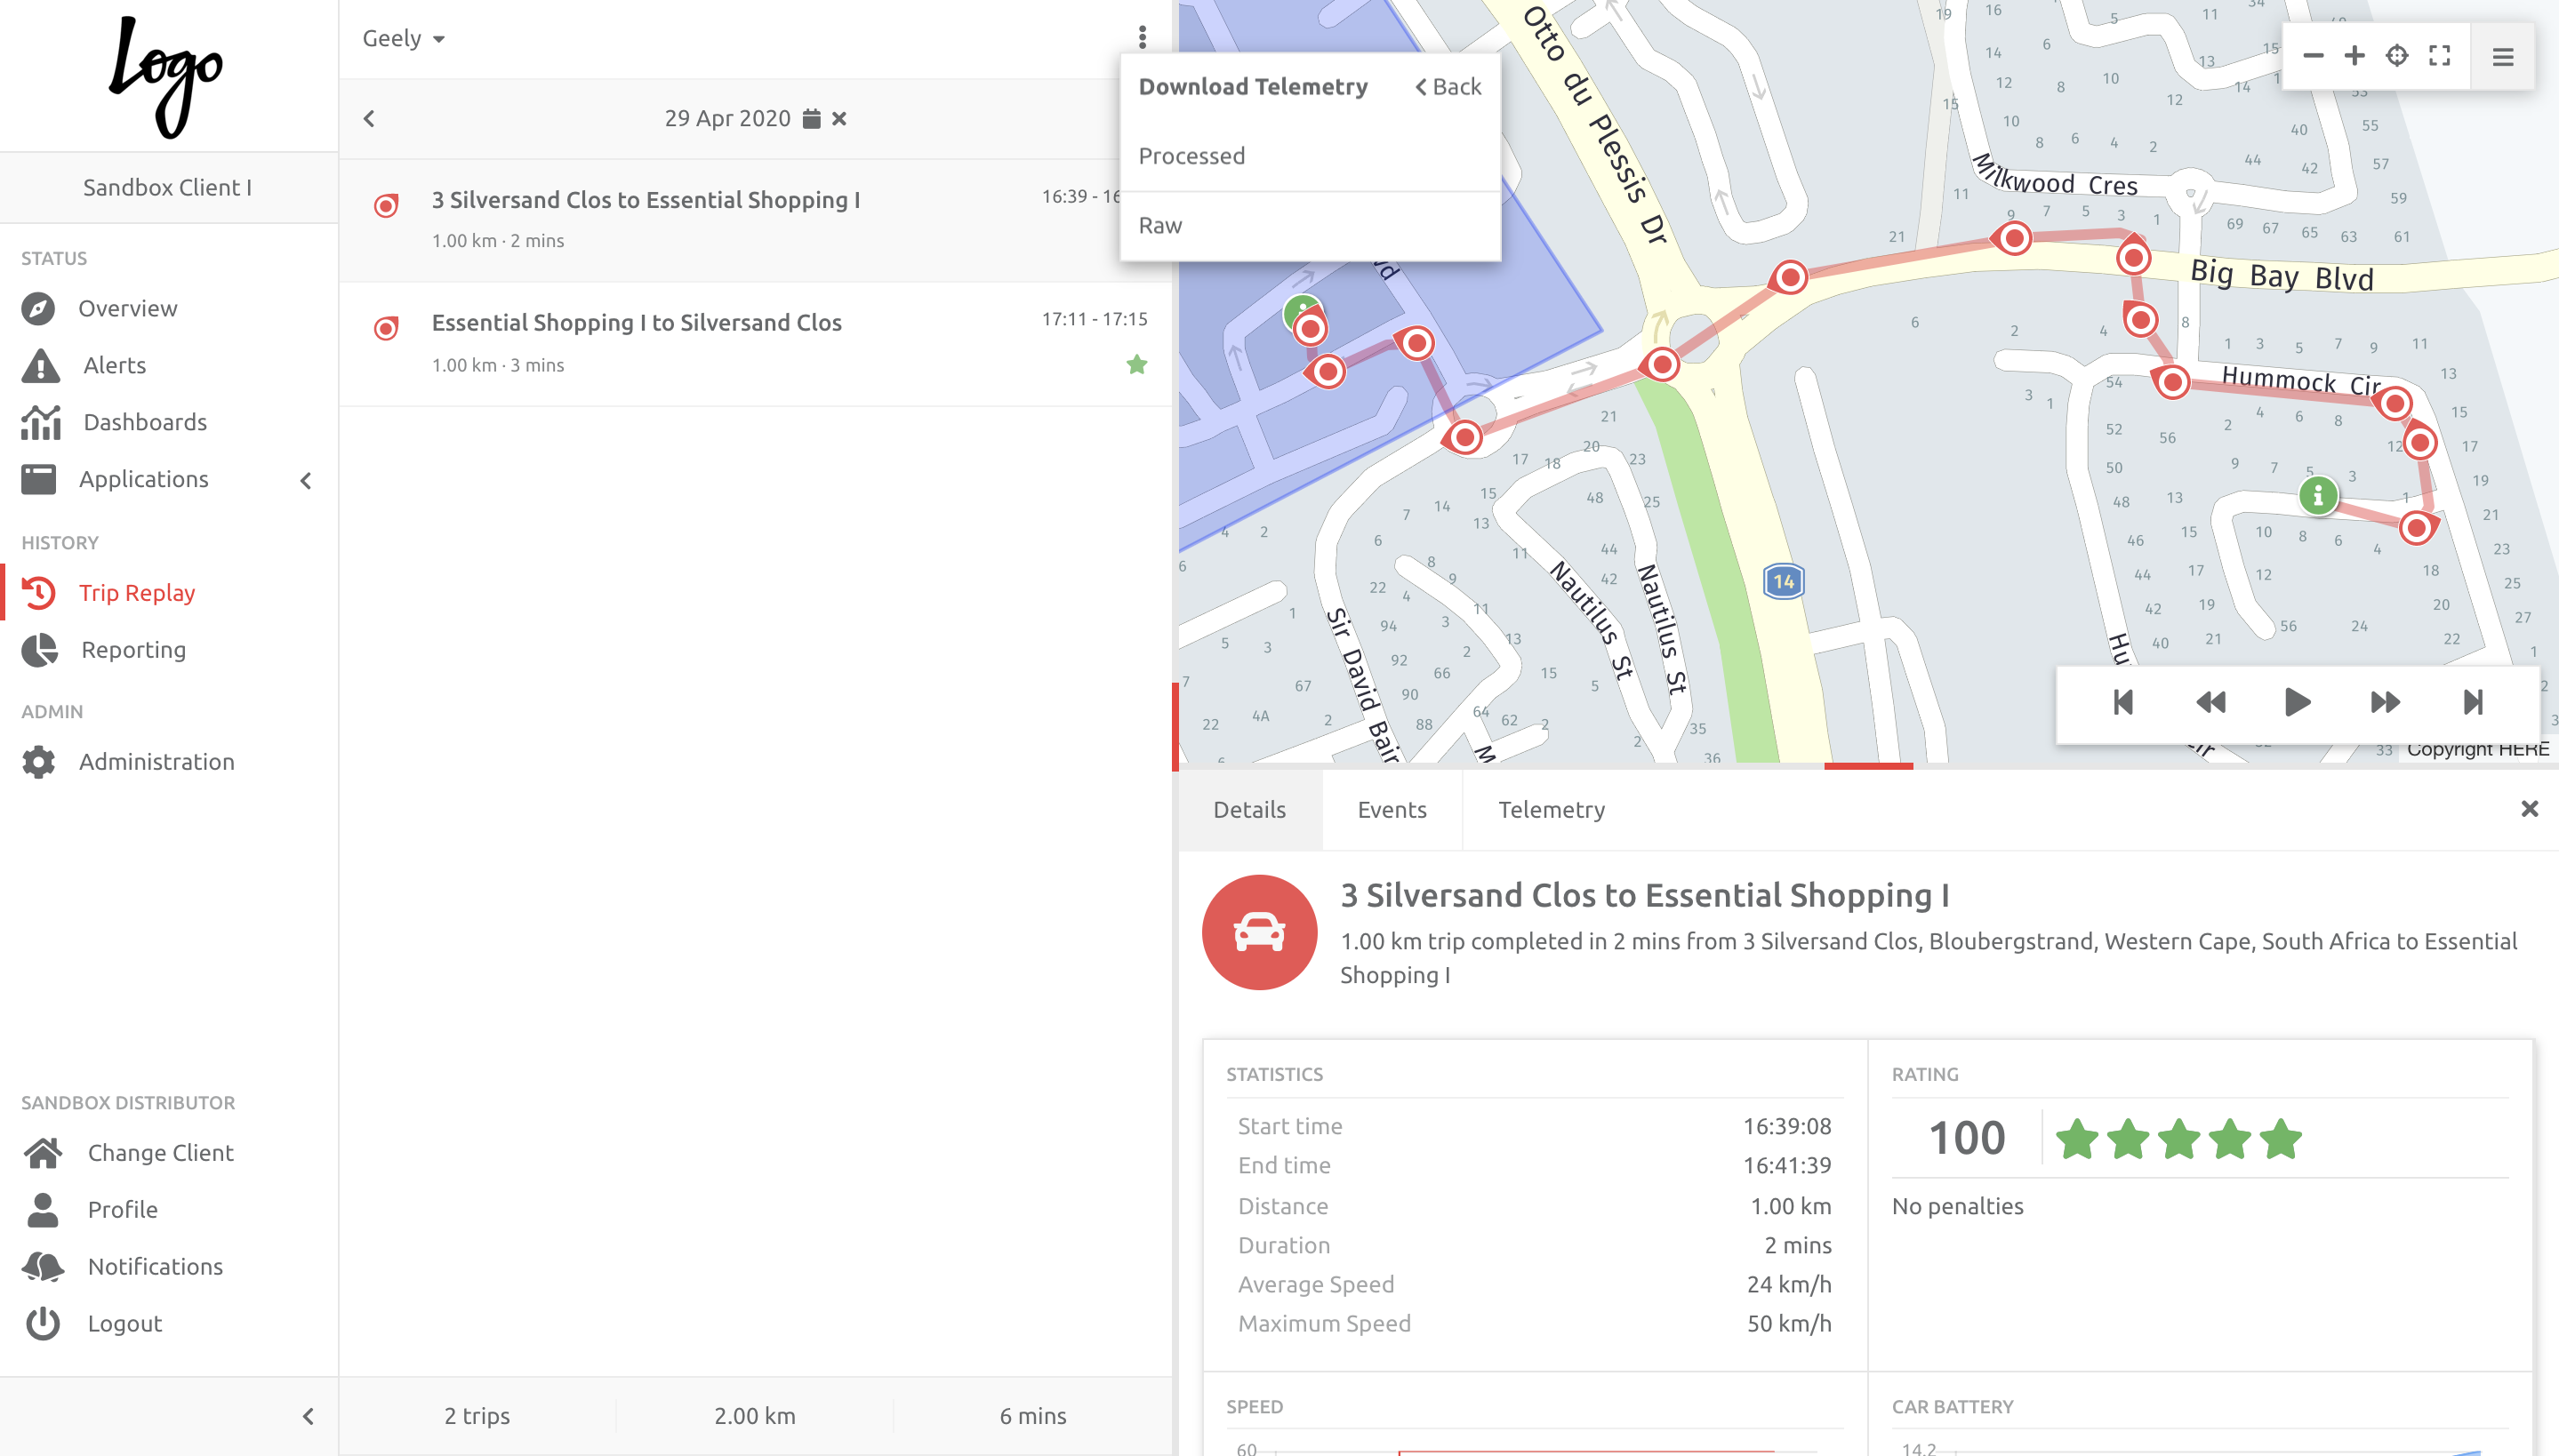
Users can choose to download and visualise the data in processed or raw format:
- raw format is what the device sends to the server, without any conversions/multipliers - distance will be in kilometers, speed km/h, temperature in celsius, analogs may be in volts etc.
- processed data is converted to any settings on the client, or IO type - for example distance may be miles, speed in mph, temperature Fahrenheit and the analog data in litres etc.
There are multiple ways to see an Asset's telemetry, whether for a day or specific trip. If trips are not being created, or their is a gap in the Device updates, then the day's telemetry is useful to troubleshoot any data or ignition-related issues.
It is important to note:
1. The platform is designed to receive certain Inputs/Outputs and Events per Device type. These can be identified under the Device Configuration document specific to the Device type.
2. If data is expected, but not appearing in the telemetry downloads, it has not been received by the platform. This means the Device is not sending it through as expected. Please contact your hardware provider to advise how to configure the specific Inputs/Events.
Downloading the Telemetry for a Day
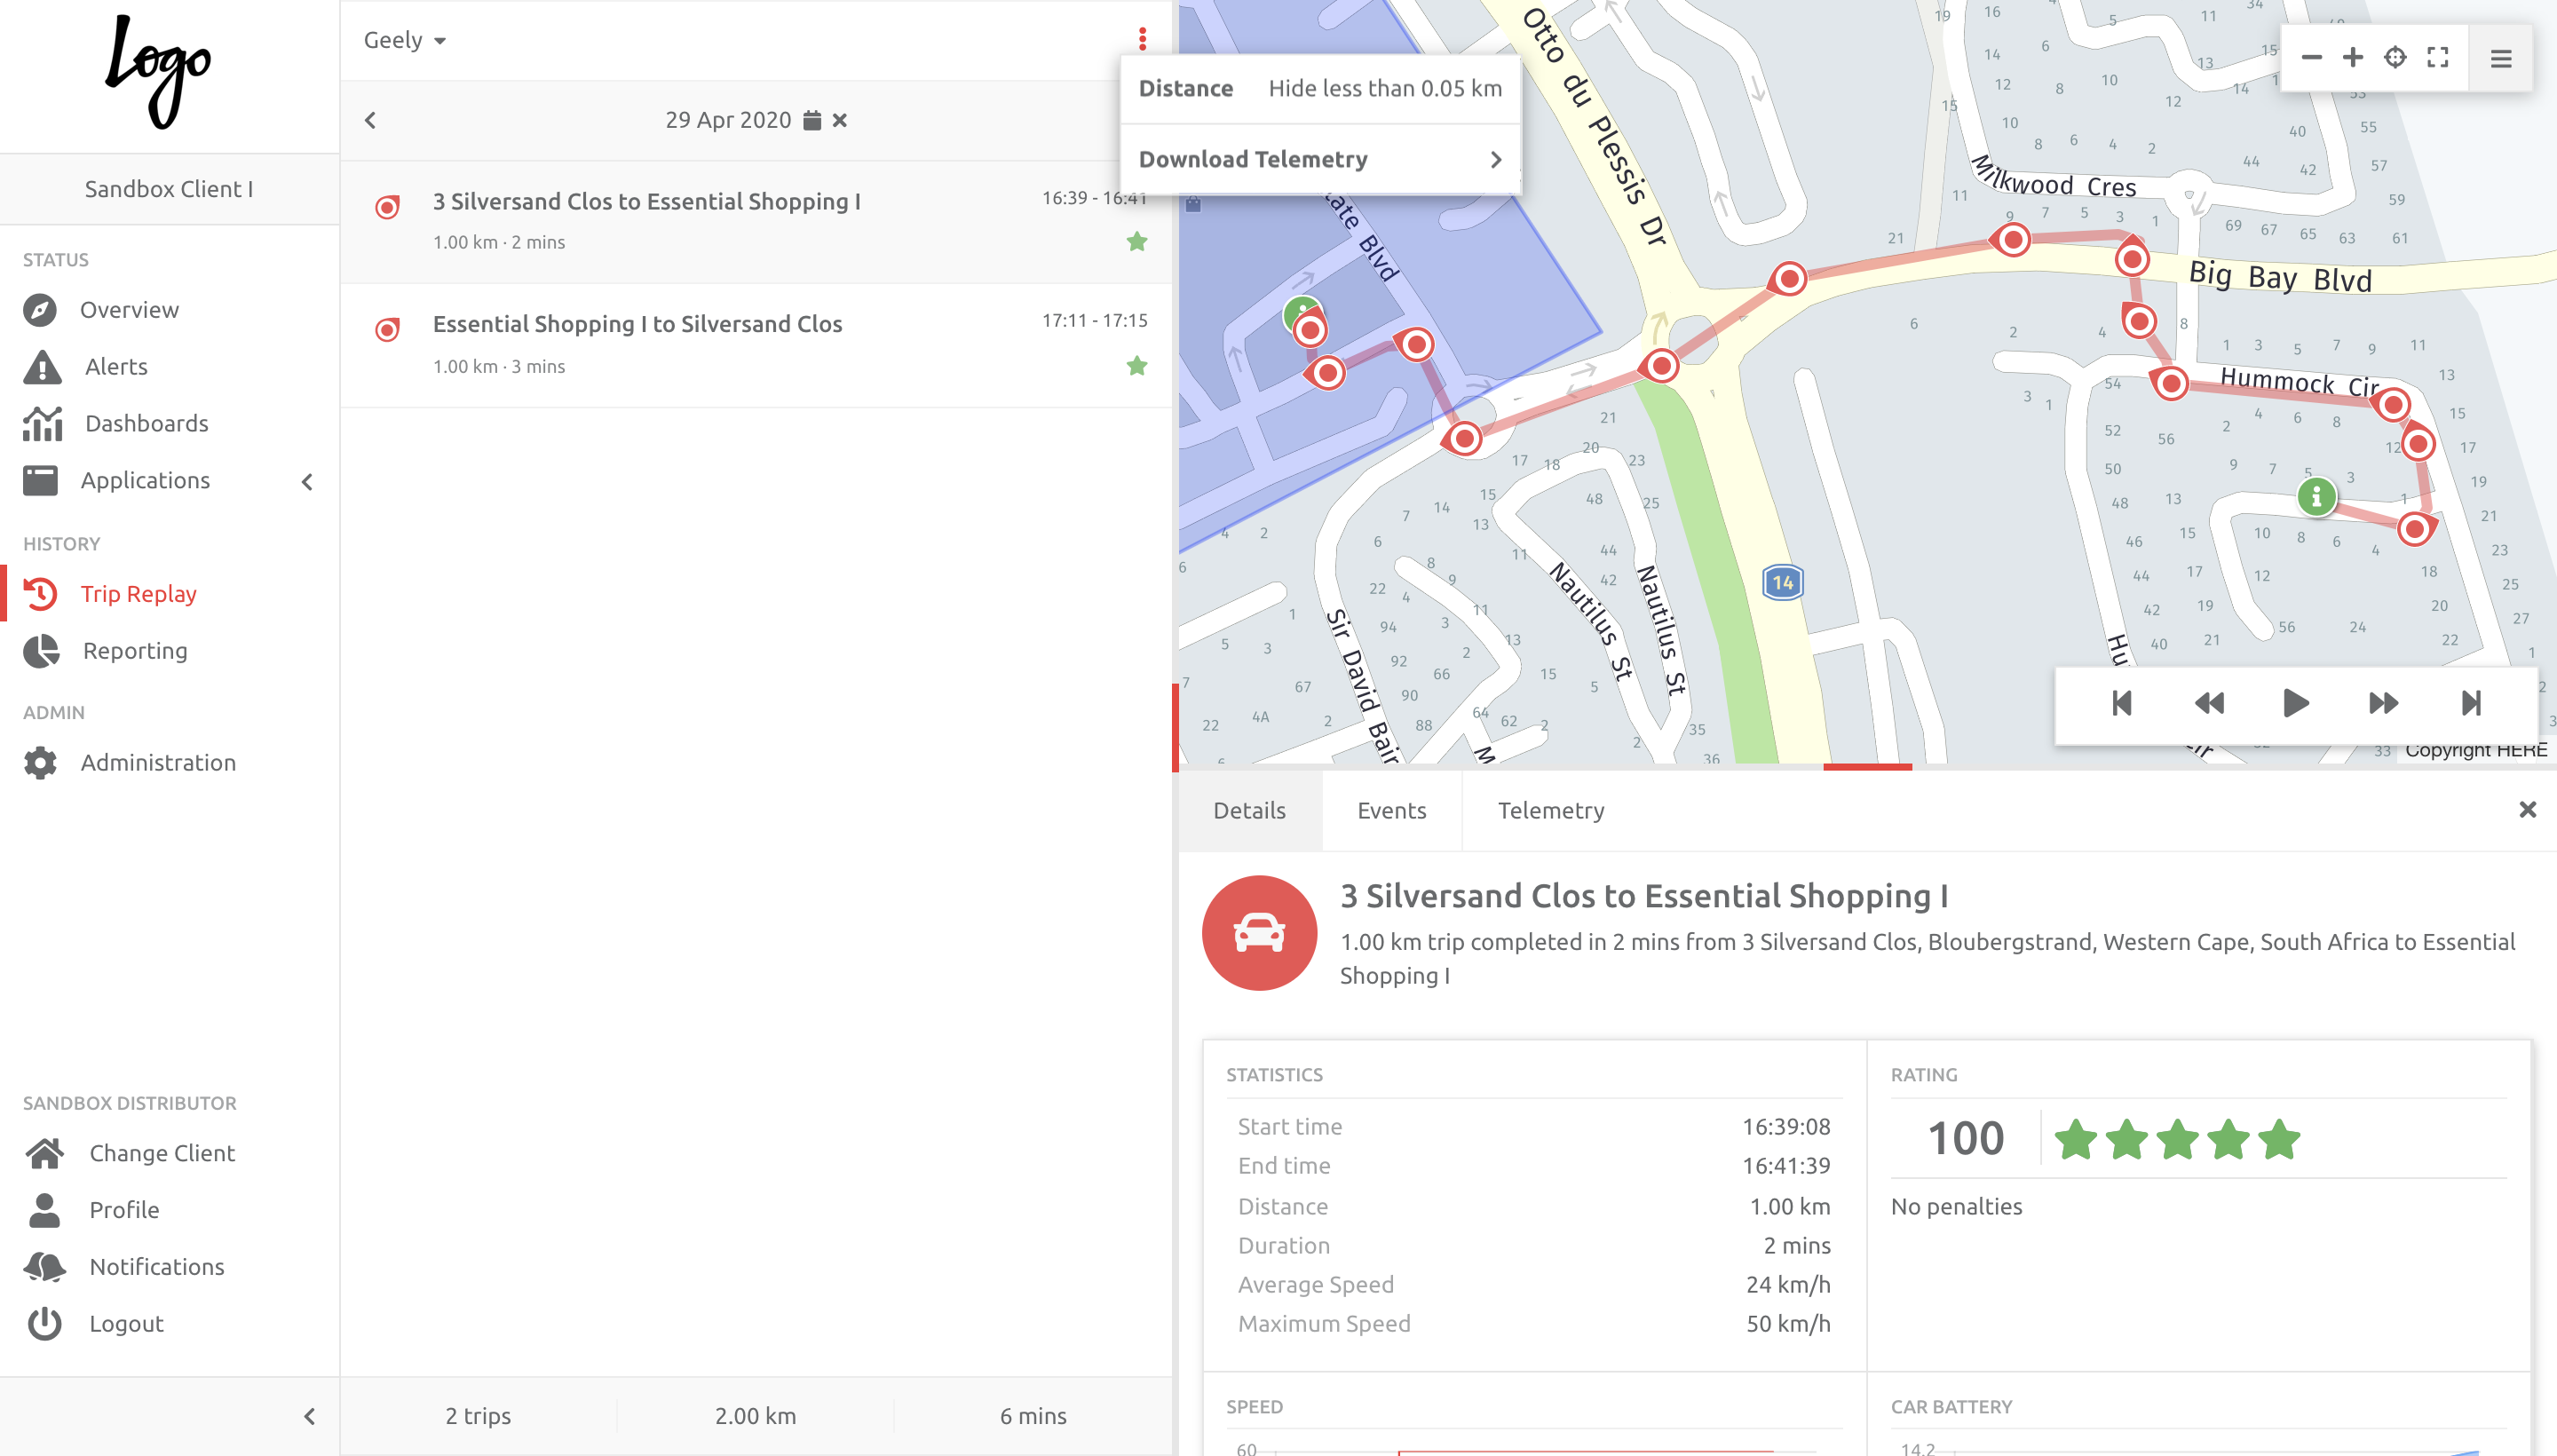
The full day's telemetry can be downloaded from the platform, in CSV format. This data is not displayed on the platform, and is only viewable in CSV format. The User can choose between downloading processed or raw data. The User chooses the Asset and Day required, and clicks the 3 button option above the trips, then Download Telemetry:
They choose the format, and the download will begin automatically:
Visualising the Telemetry for a Trip
Choose the Telemetry tab under the Trip in question:
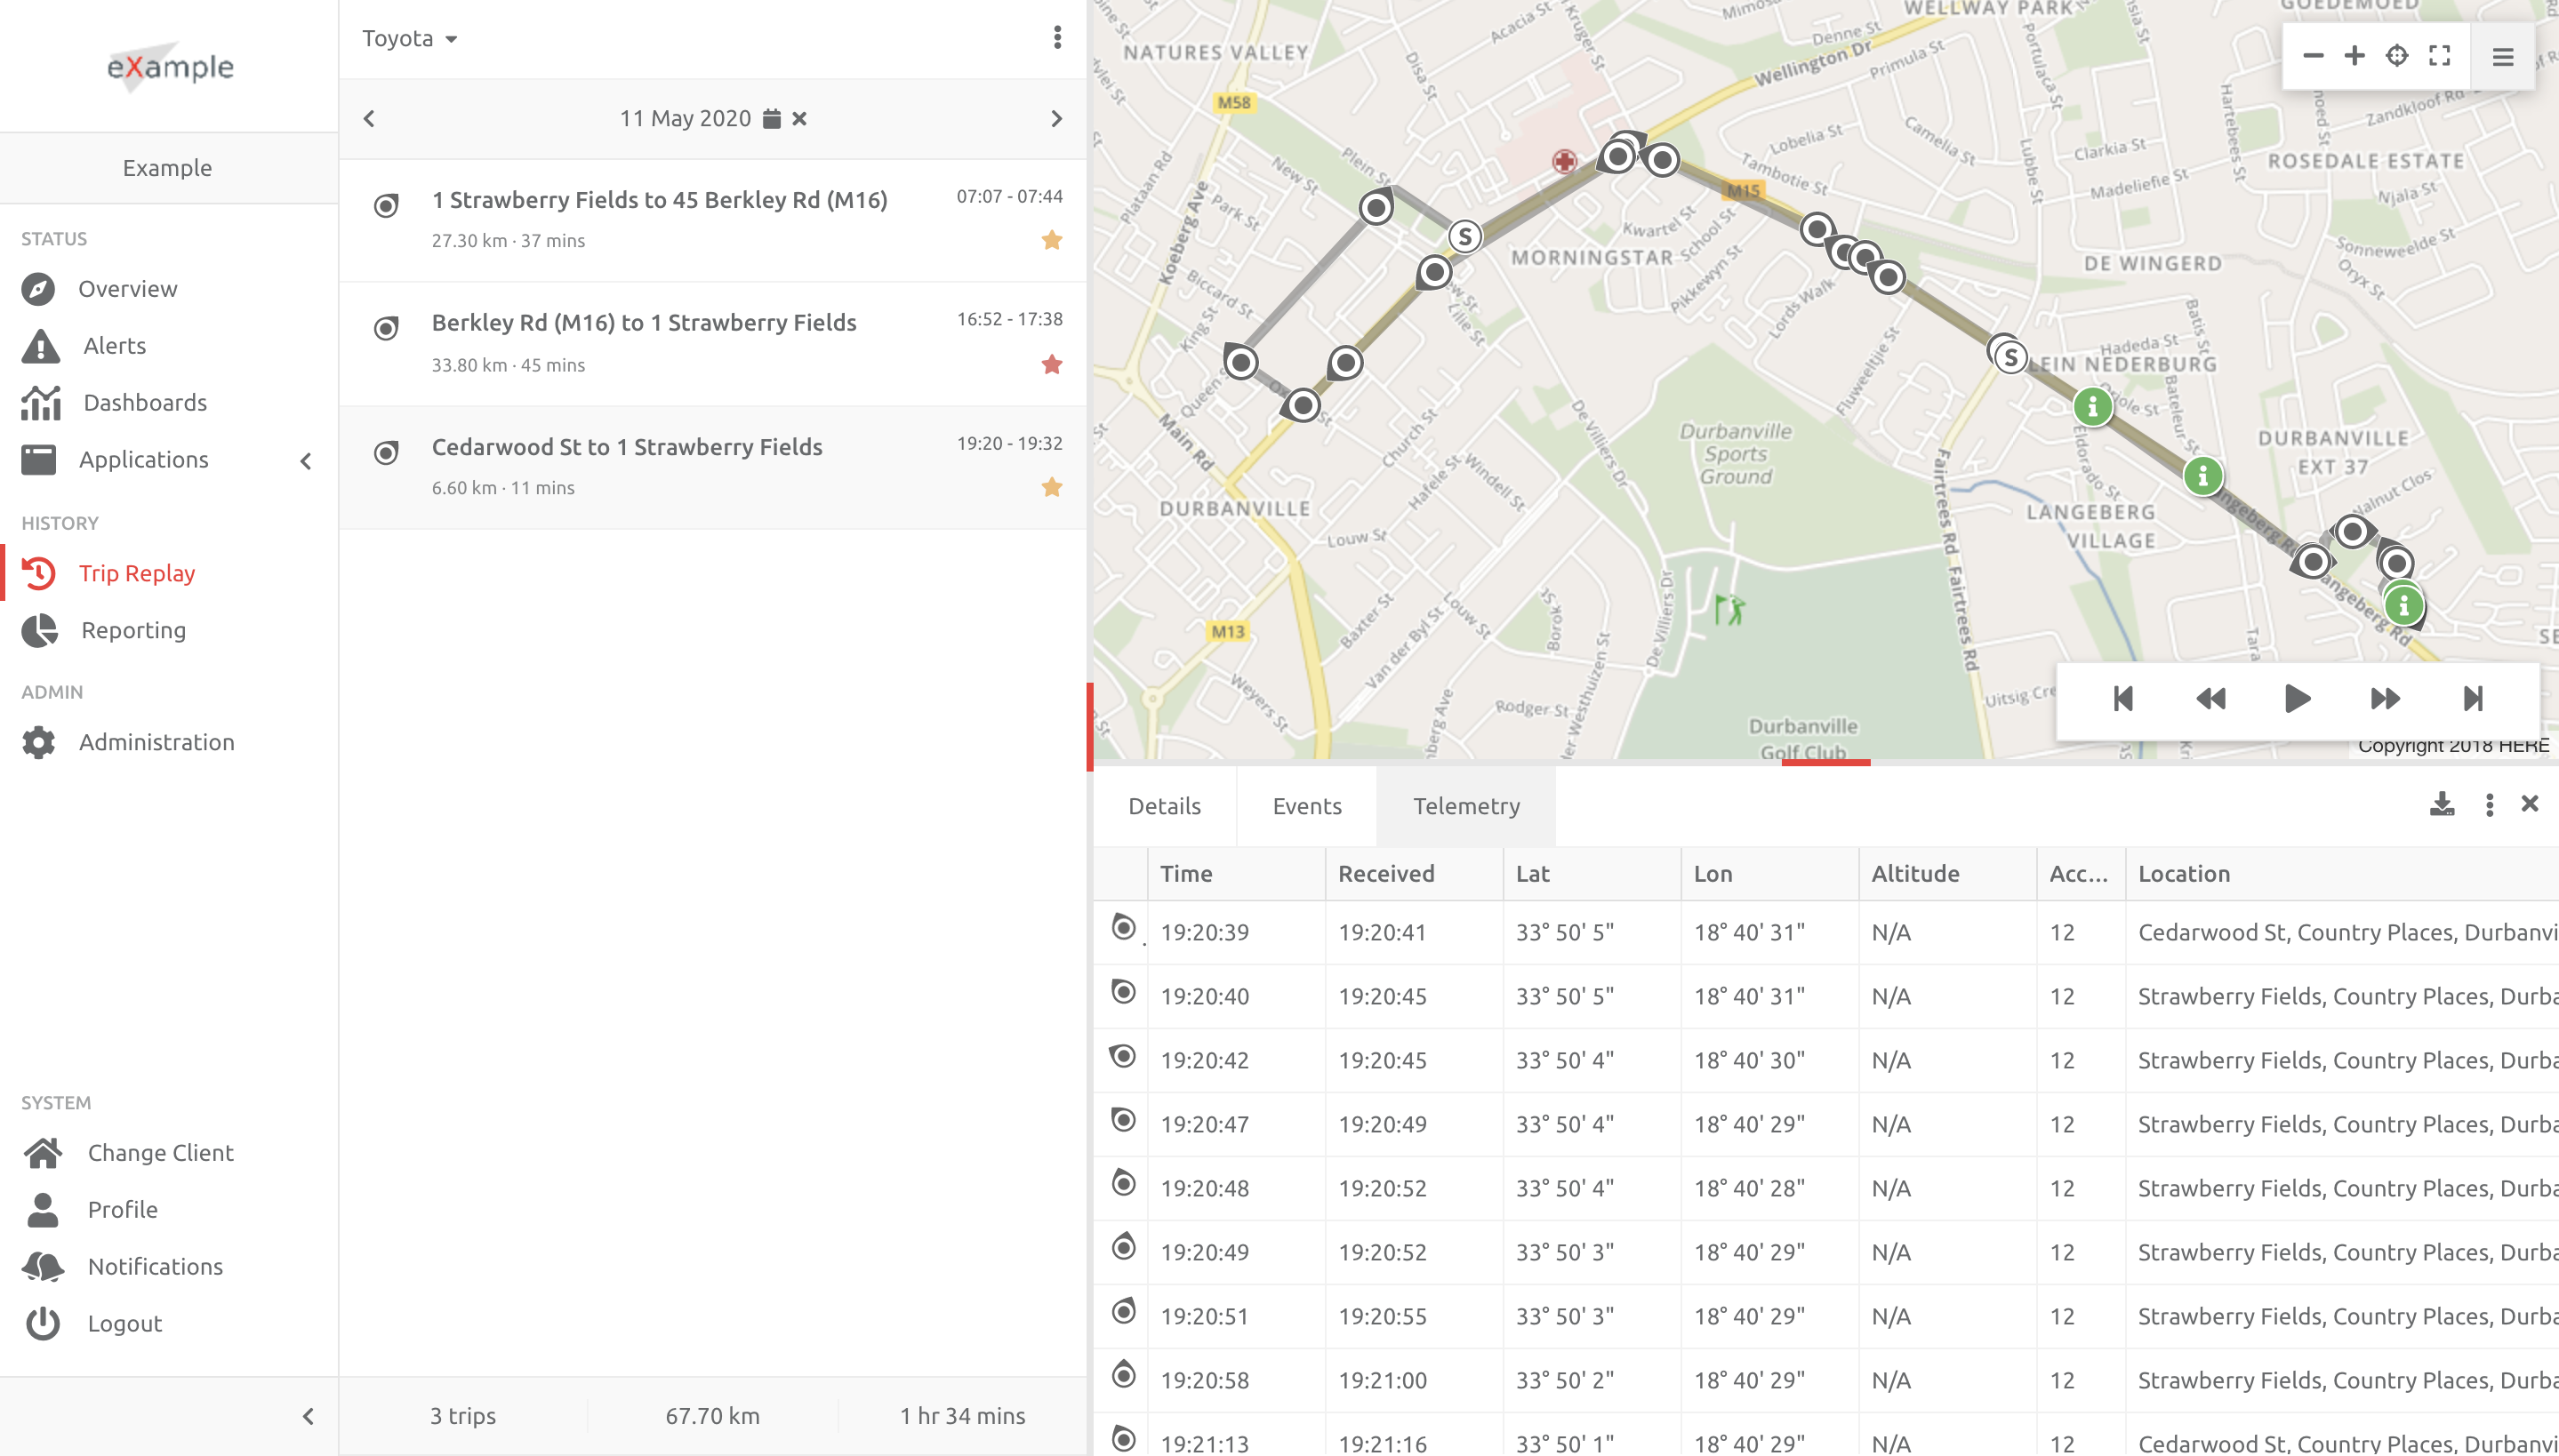
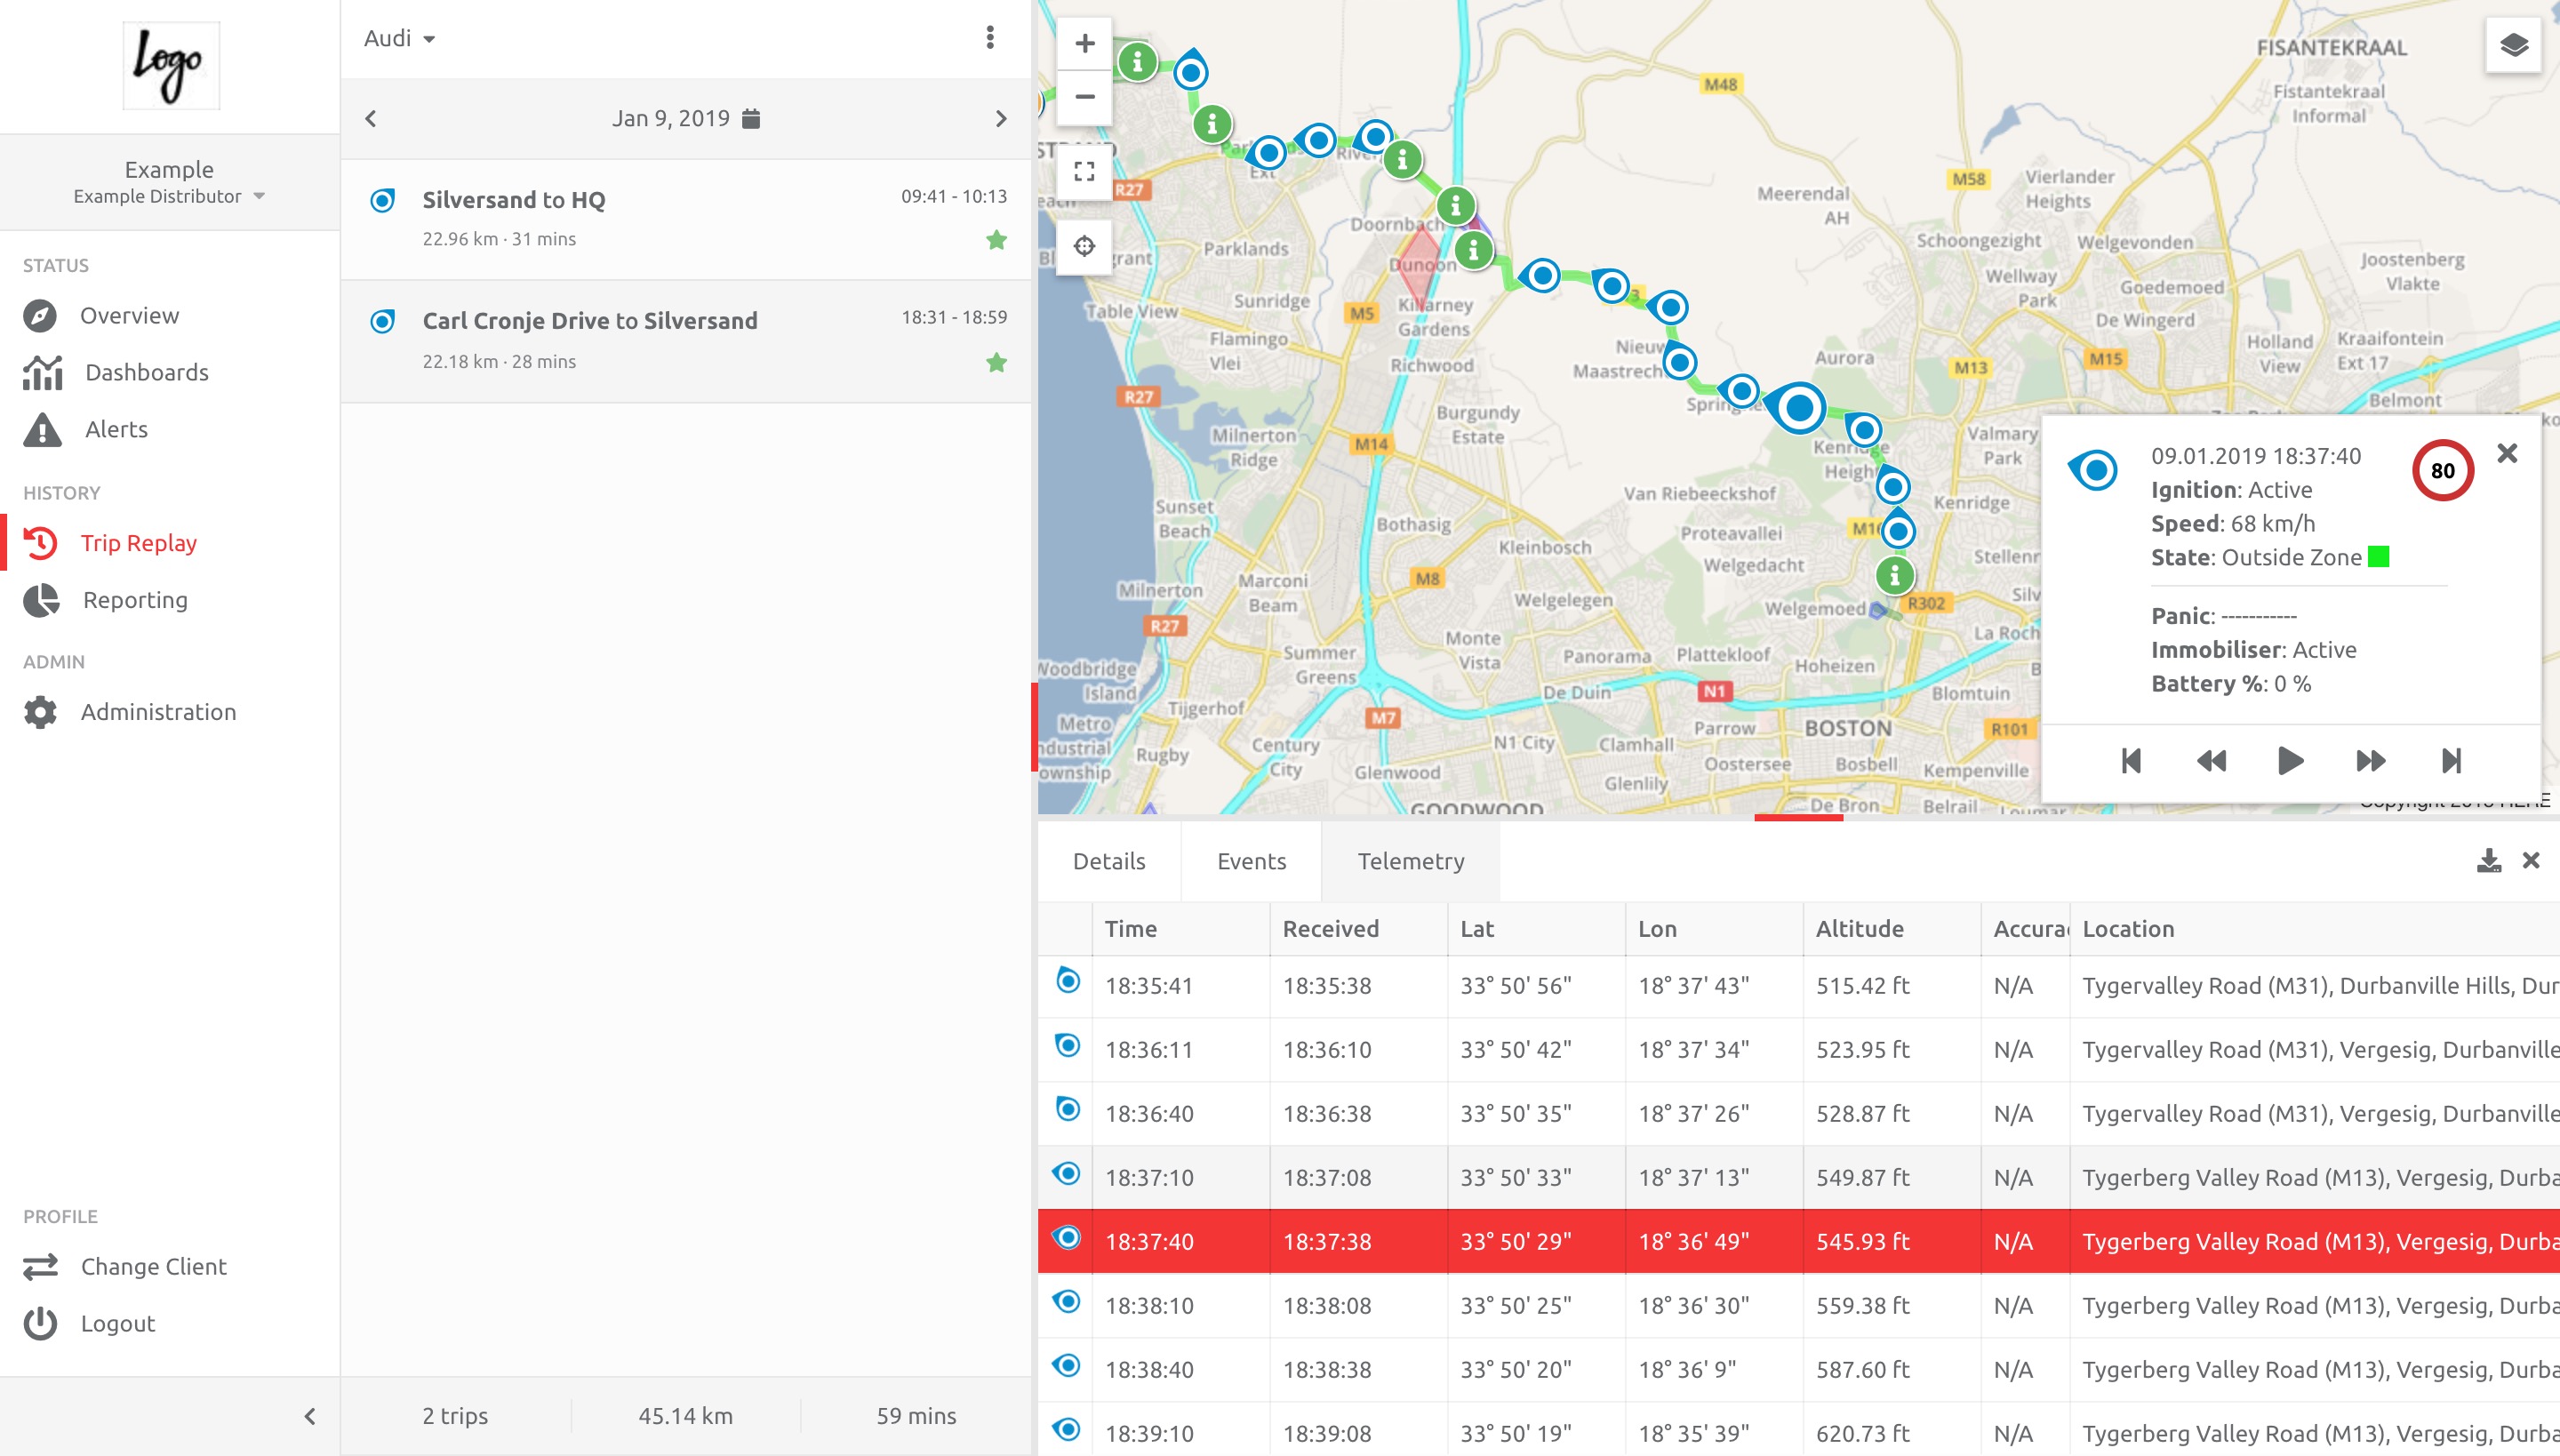
The data points are listed. The items common across all Device types are described in the table below:
| Column Heading |
Description |
| Time |
The time the Device created the data packet. |
| Received |
The time the server received the data packet. |
| Lat / Long |
The latitude and longitude values received from the Device. |
| Location |
The latitude and longitude values received from the Device converted into a location on the map. |
| analog_x |
The analog information received from the Device, including which input it was received on. |
| digital_x |
The digital information received from the Device, including which input it was received on. |
| odometer / odo_counter |
odometer = odometer value is being received from the Device. odo_counter = the platform is calculating the odometer value of the Asset (no Device odometer). |
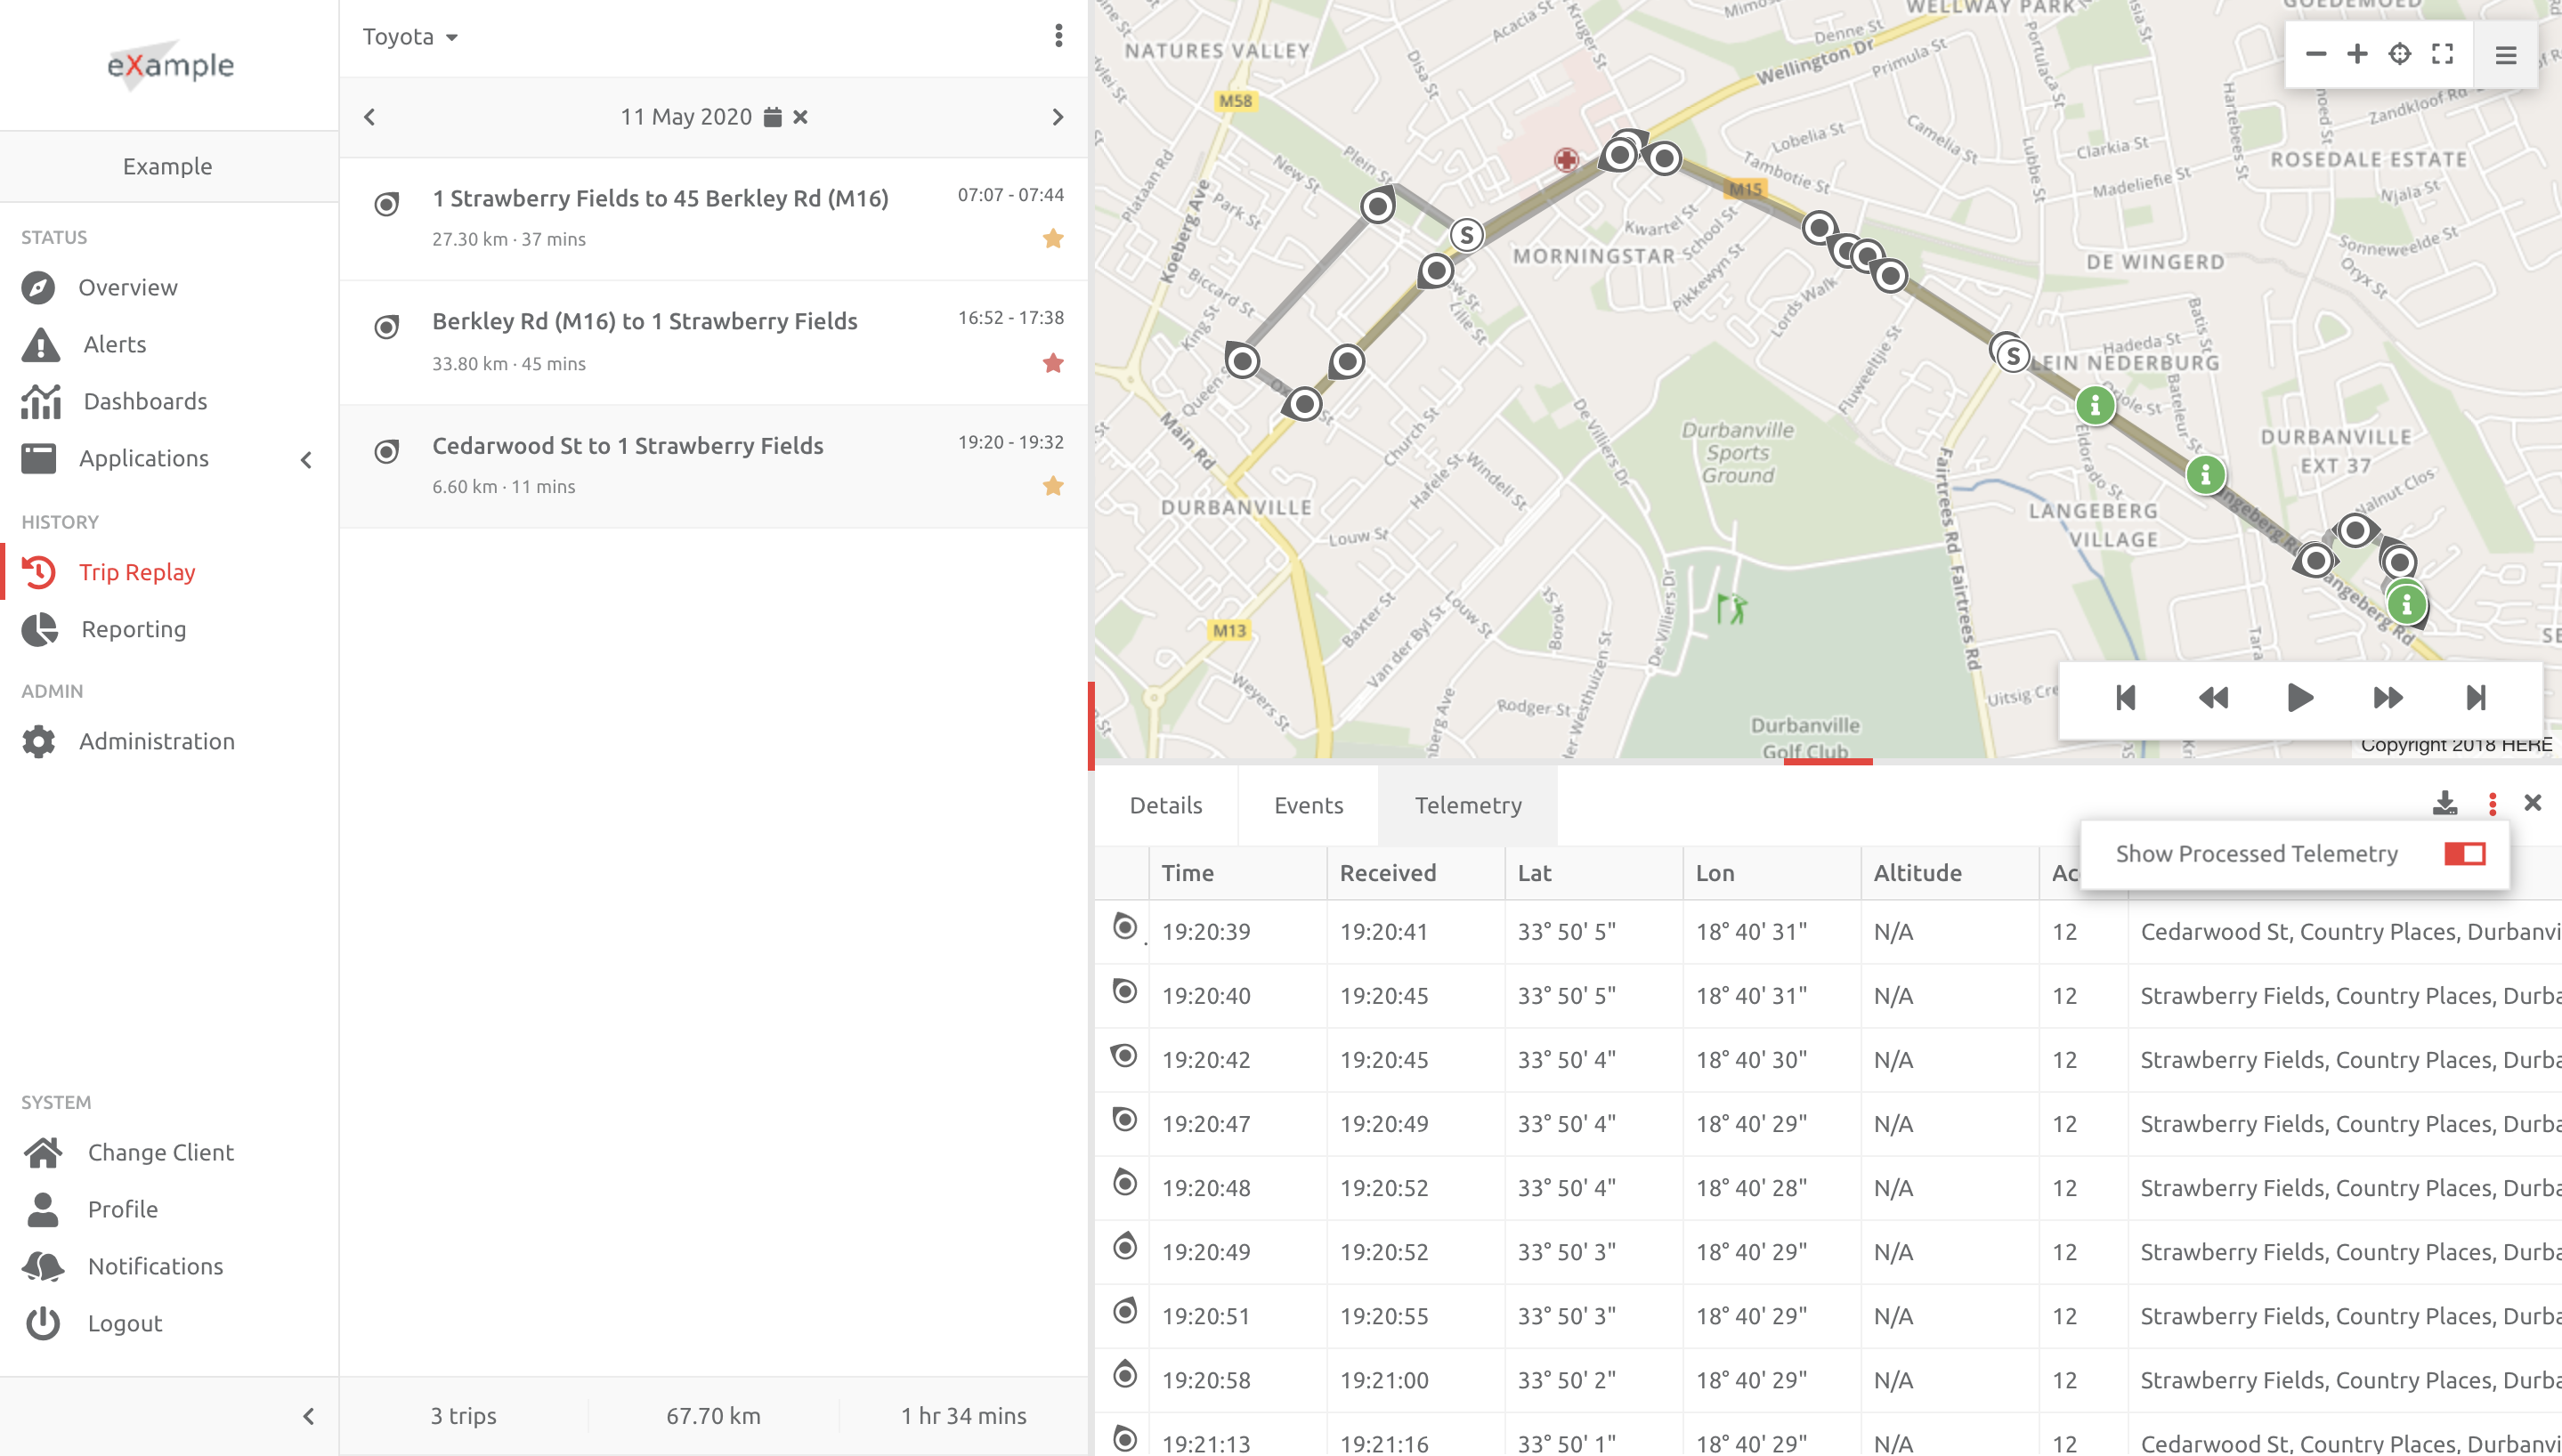
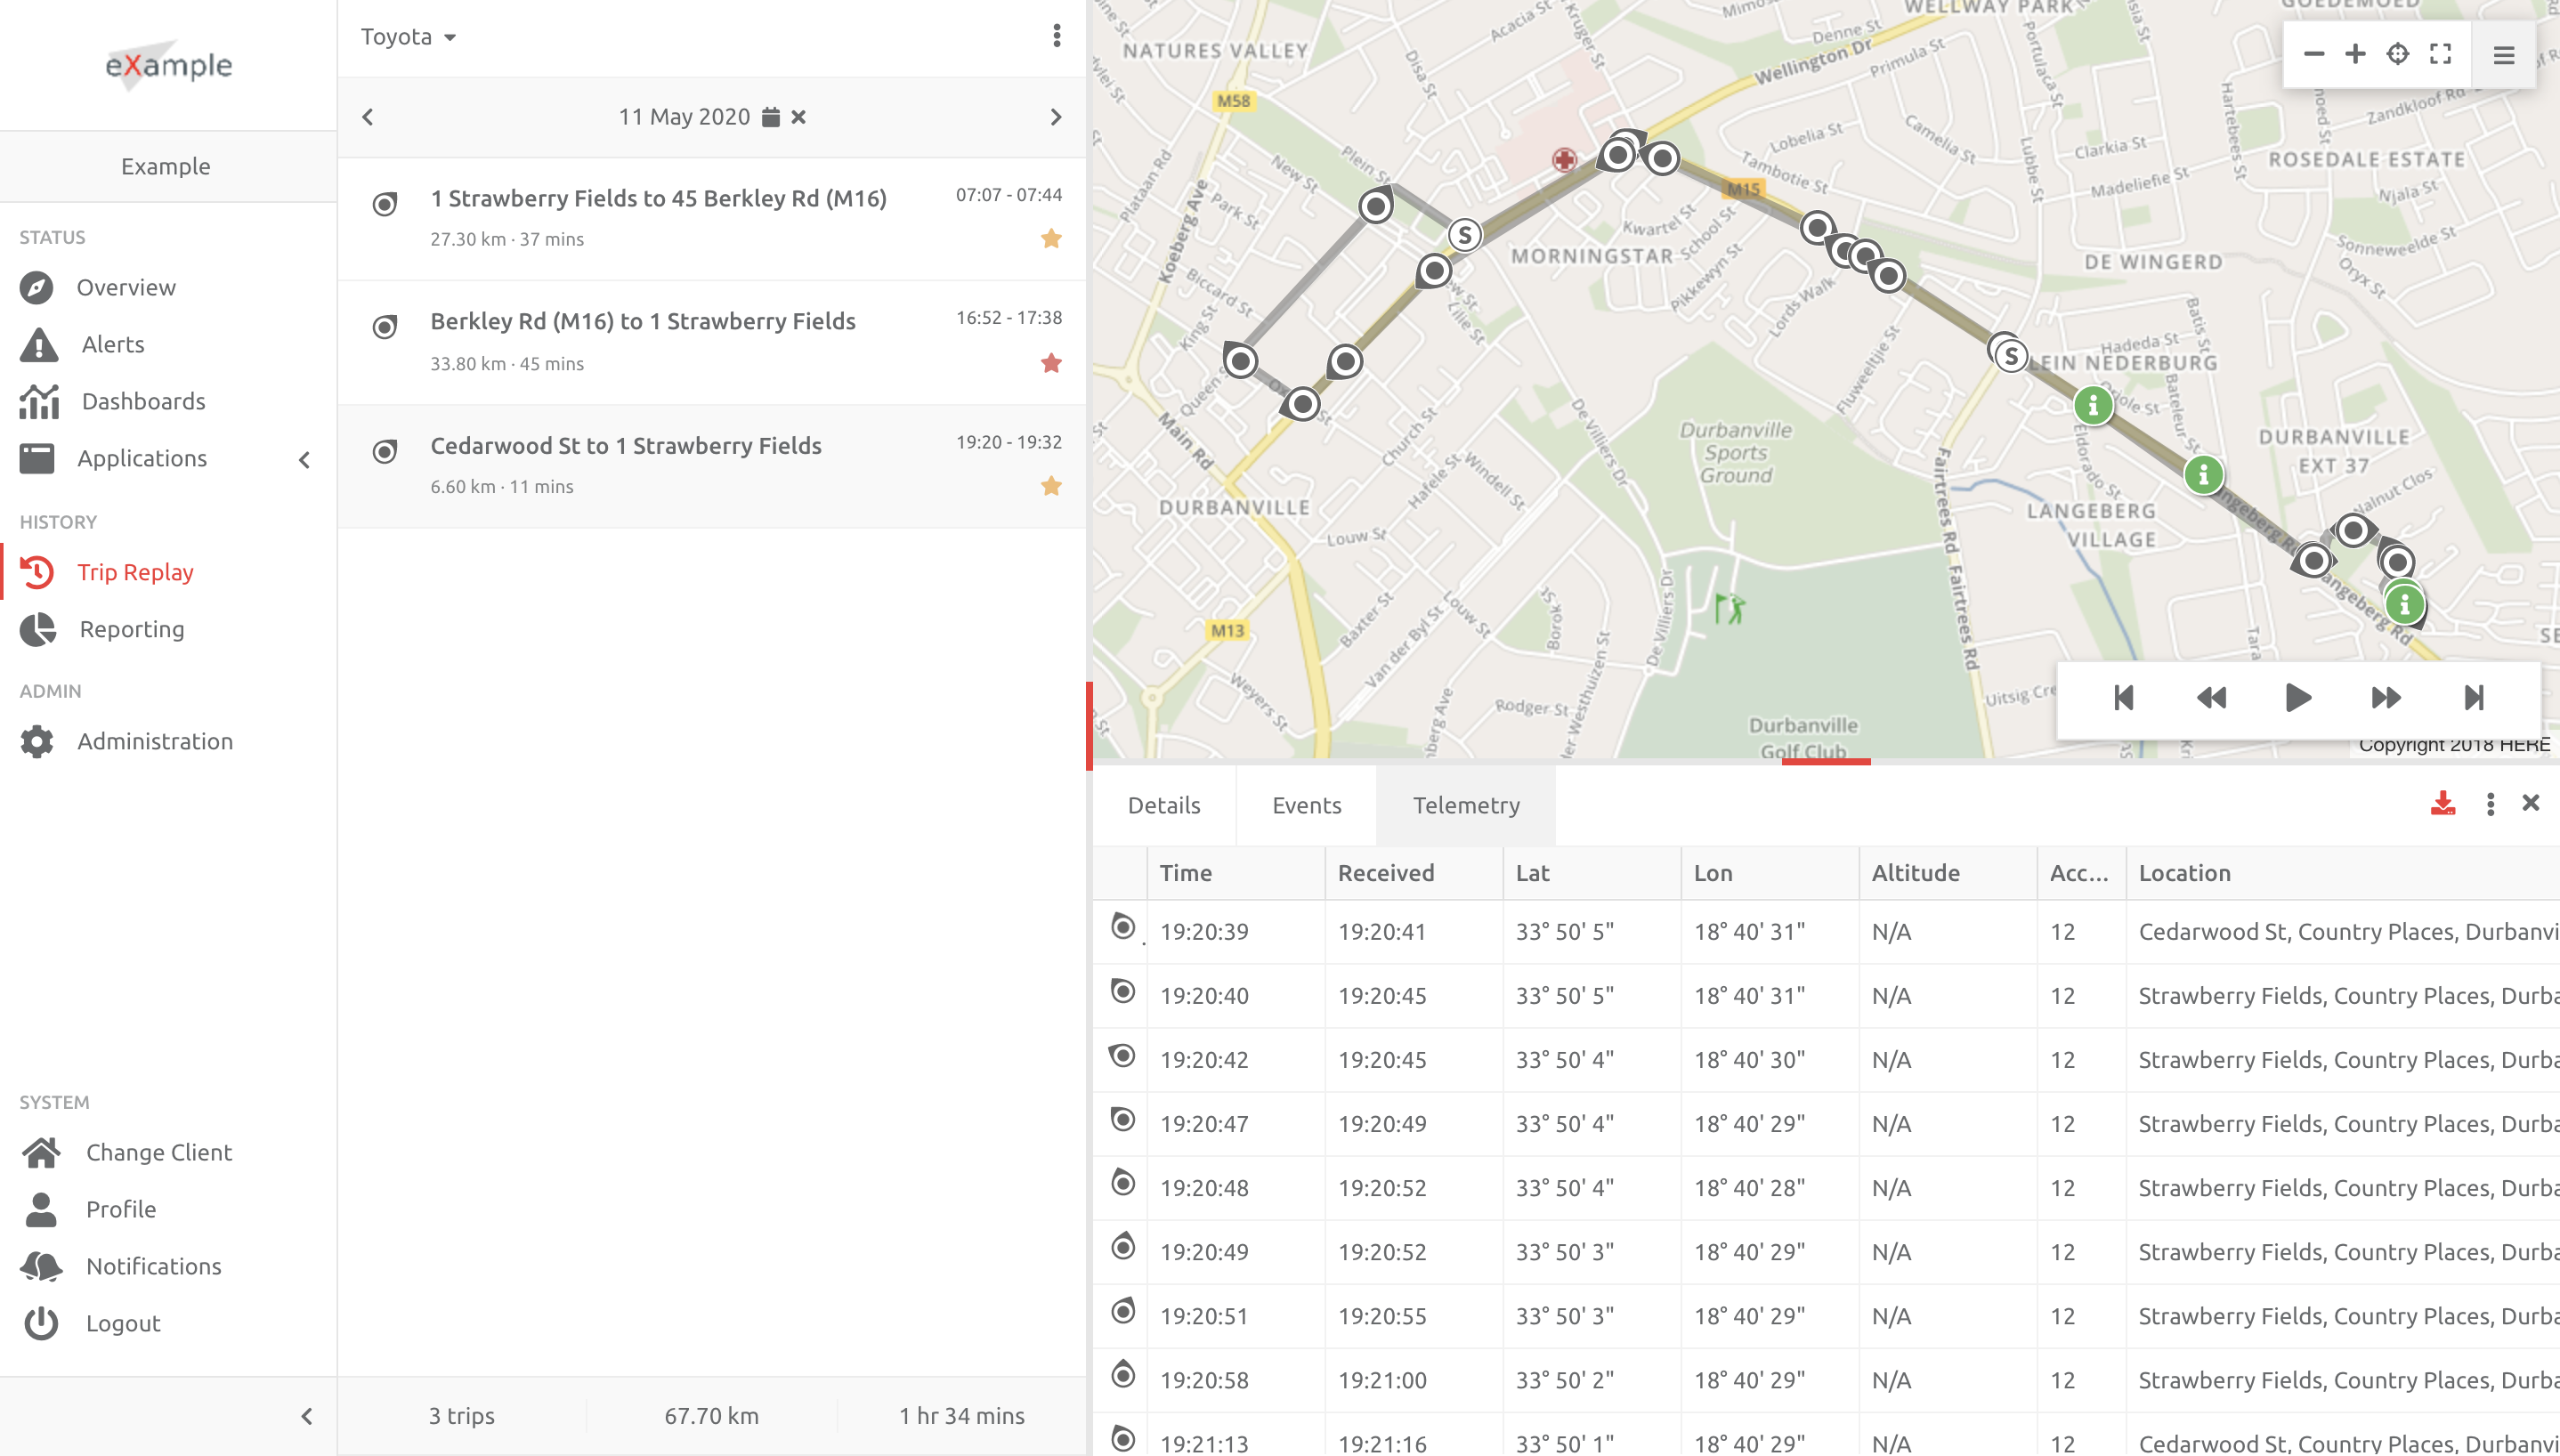
By default the data shown is processed, and can be converted to raw by choosing the 3 button option on the right of the screen:
Click a data point in the Telemetry. This will show up on the map, and identify where and what information was present at that point:
Downloading the Telemetry
Users can download the Telemetry in Processed or Raw format for the trip, in CSV format. When downloading, the data will be in the format chosen (as above). Click the download button to automatically download the telemetry:
Comments
0 comments
Please sign in to leave a comment.