Introduction
The Overview screen has multiple functions, including showing where an Asset is, where it was, what alerts have been generated in the last few days, and what telemetry is coming from the Device. The screen itself can be customised to display certain Assets, in a certain way. Please see below for an explanation.
Once changes have been made, and you or the customer log out, or switch account, these settings are stored in the browser cache, and will re-appear on opening the Client again.
NB if you or your customer clear your browser cache, these settings are reset.
Changing View Options
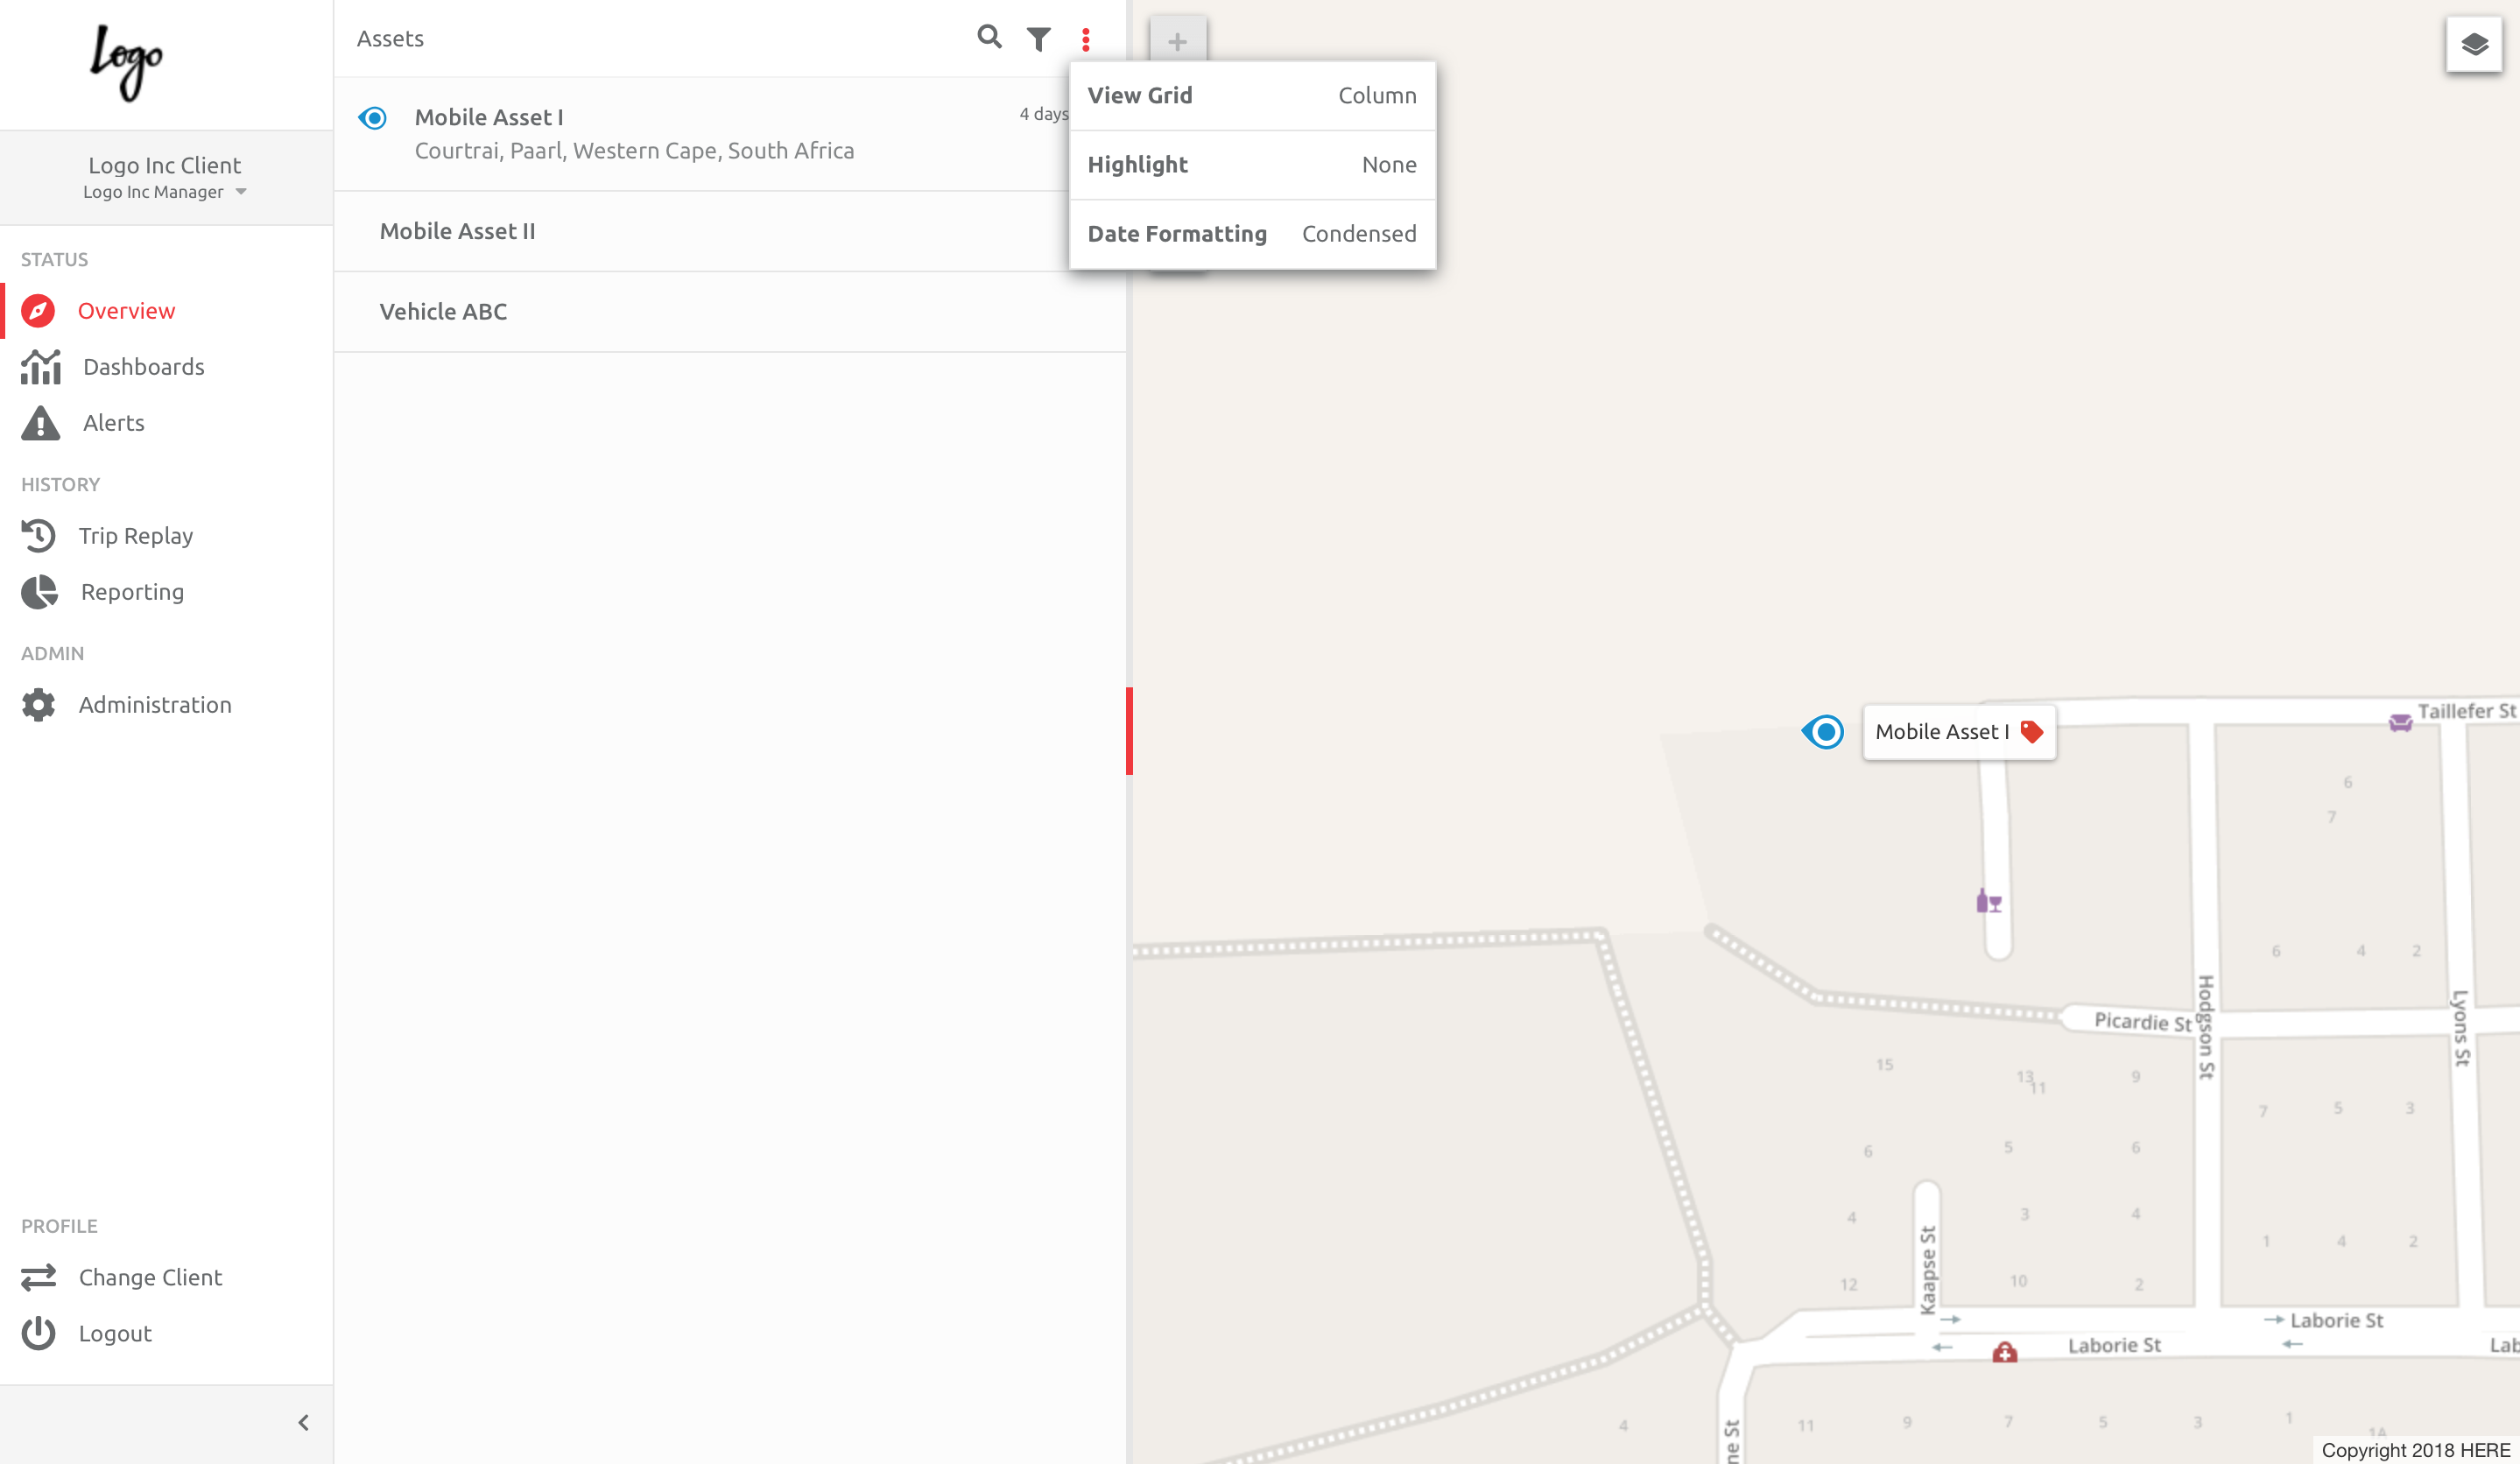
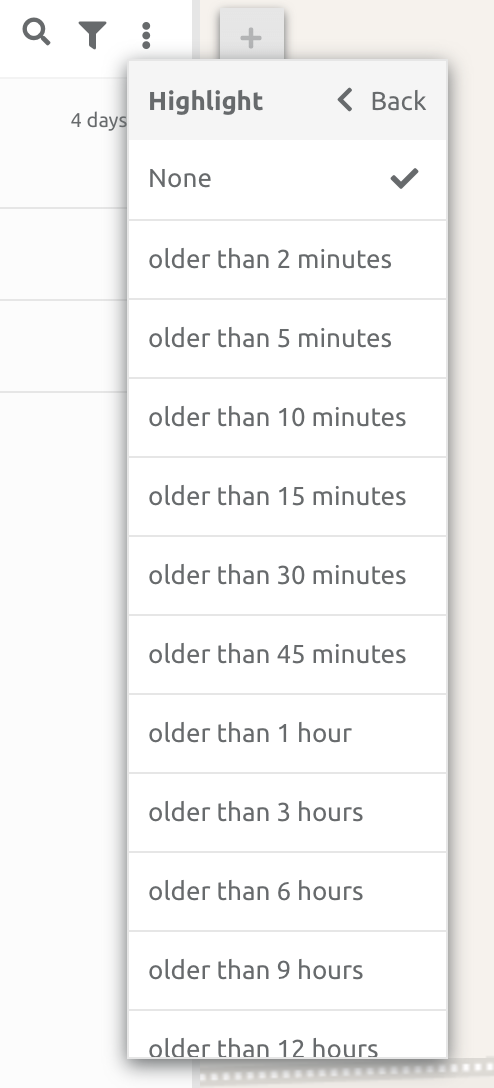
The Options button allows users to change the Asset View, Highlight update times, and Change the Date Format. The Options button is represented as 3 dots, right hand side of the header. Clicking the button opens another window, with the various options that can be changed.
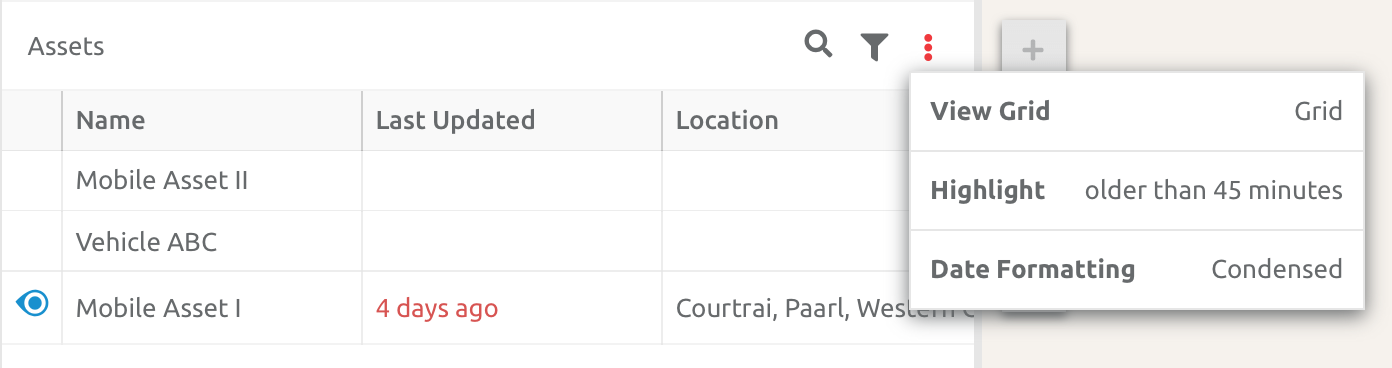
In the example below, the Highlight section was chosen, and any Asset updating longer than 45 minutes ago will be highlighted red:
Filtering Assets
Assets can be filtered by Cost Centre, Asset Groups, Types and Category. The filter function is on the right hand side of the header. Once the filter button is clicked, a new window opens, with the Cost Centre, Asset Group, Asset Category and Asset Types options.
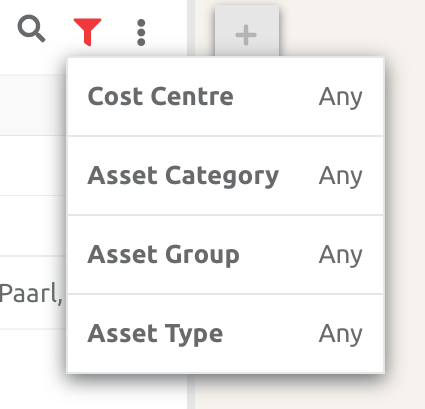
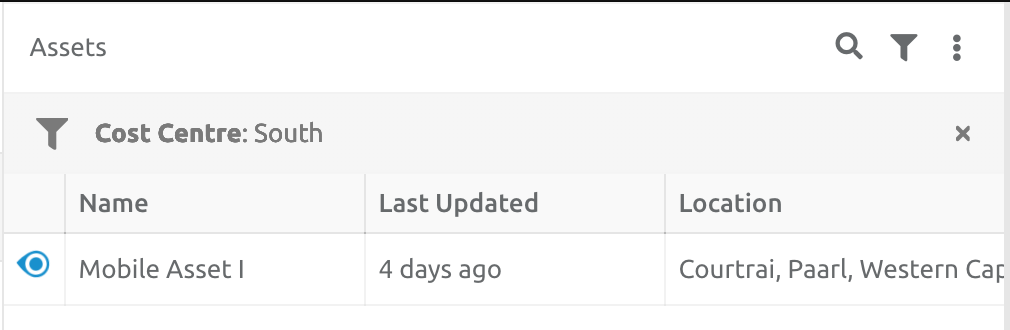
In the example below, Cost Centres were chosen, for the South centre. The filter can be removed by clicking the X.
Searching for Assets
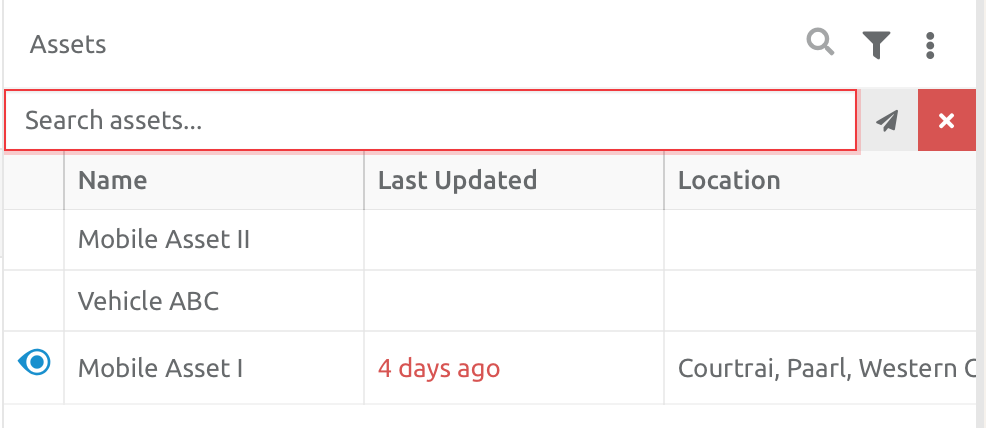
Not all Assets may display on the Overview screen, however can be found through the search function. The search function is on the right hand side of the header. Once the search button is clicked, a new window opens, where you can enter the name of the Asset, and choose Enter, or click the send button. To cancel the search, click the X button.
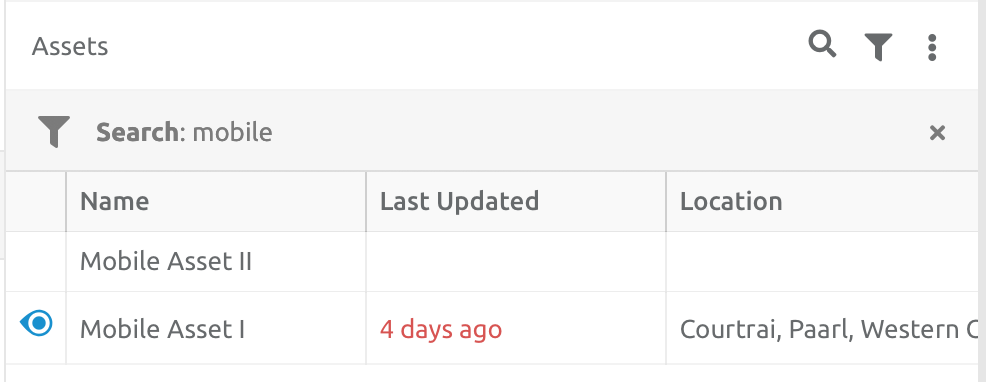
Once the search find the Asset, or Assets with the search parameters, they are displayed in the list below. The search parameter is shown, and can be removed by clicking the X.
Add Extra Columns
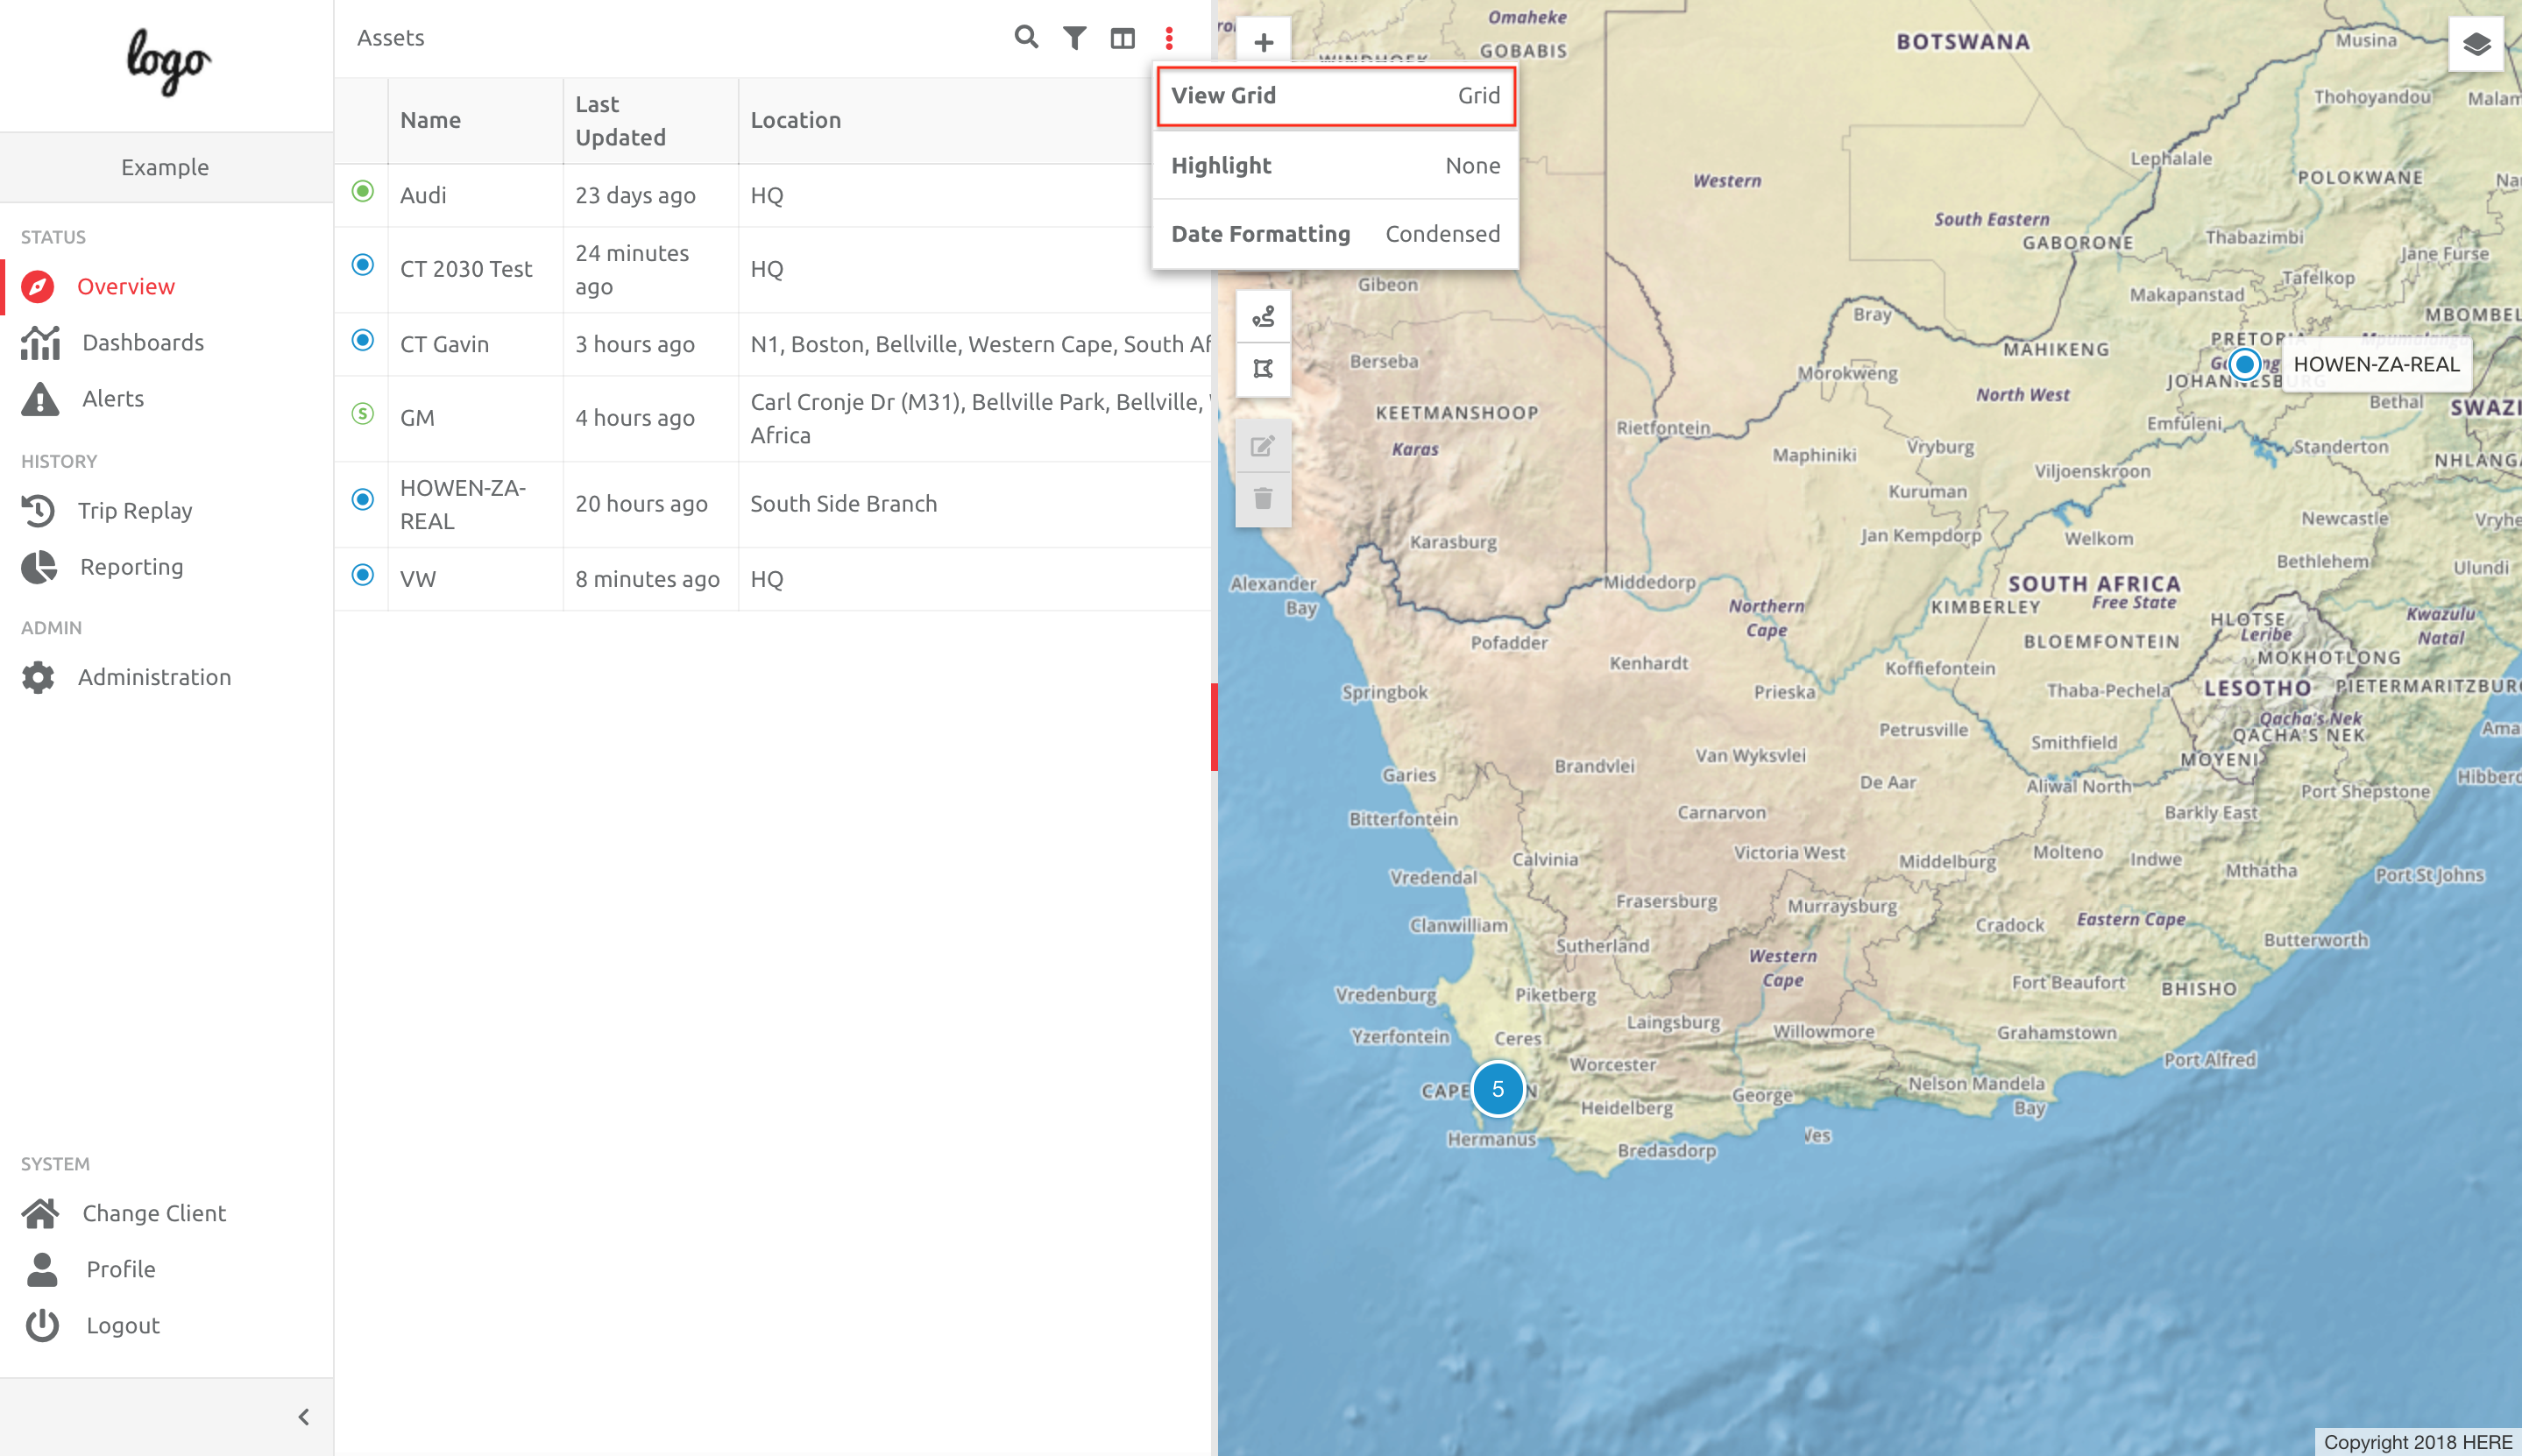
Users are able to add extra columns with data from the telemetry, IOs and Asset States. This feature is only available in Grid view. To add extra columns, click the Options above the Asset list, and choose Grid from View Grid:
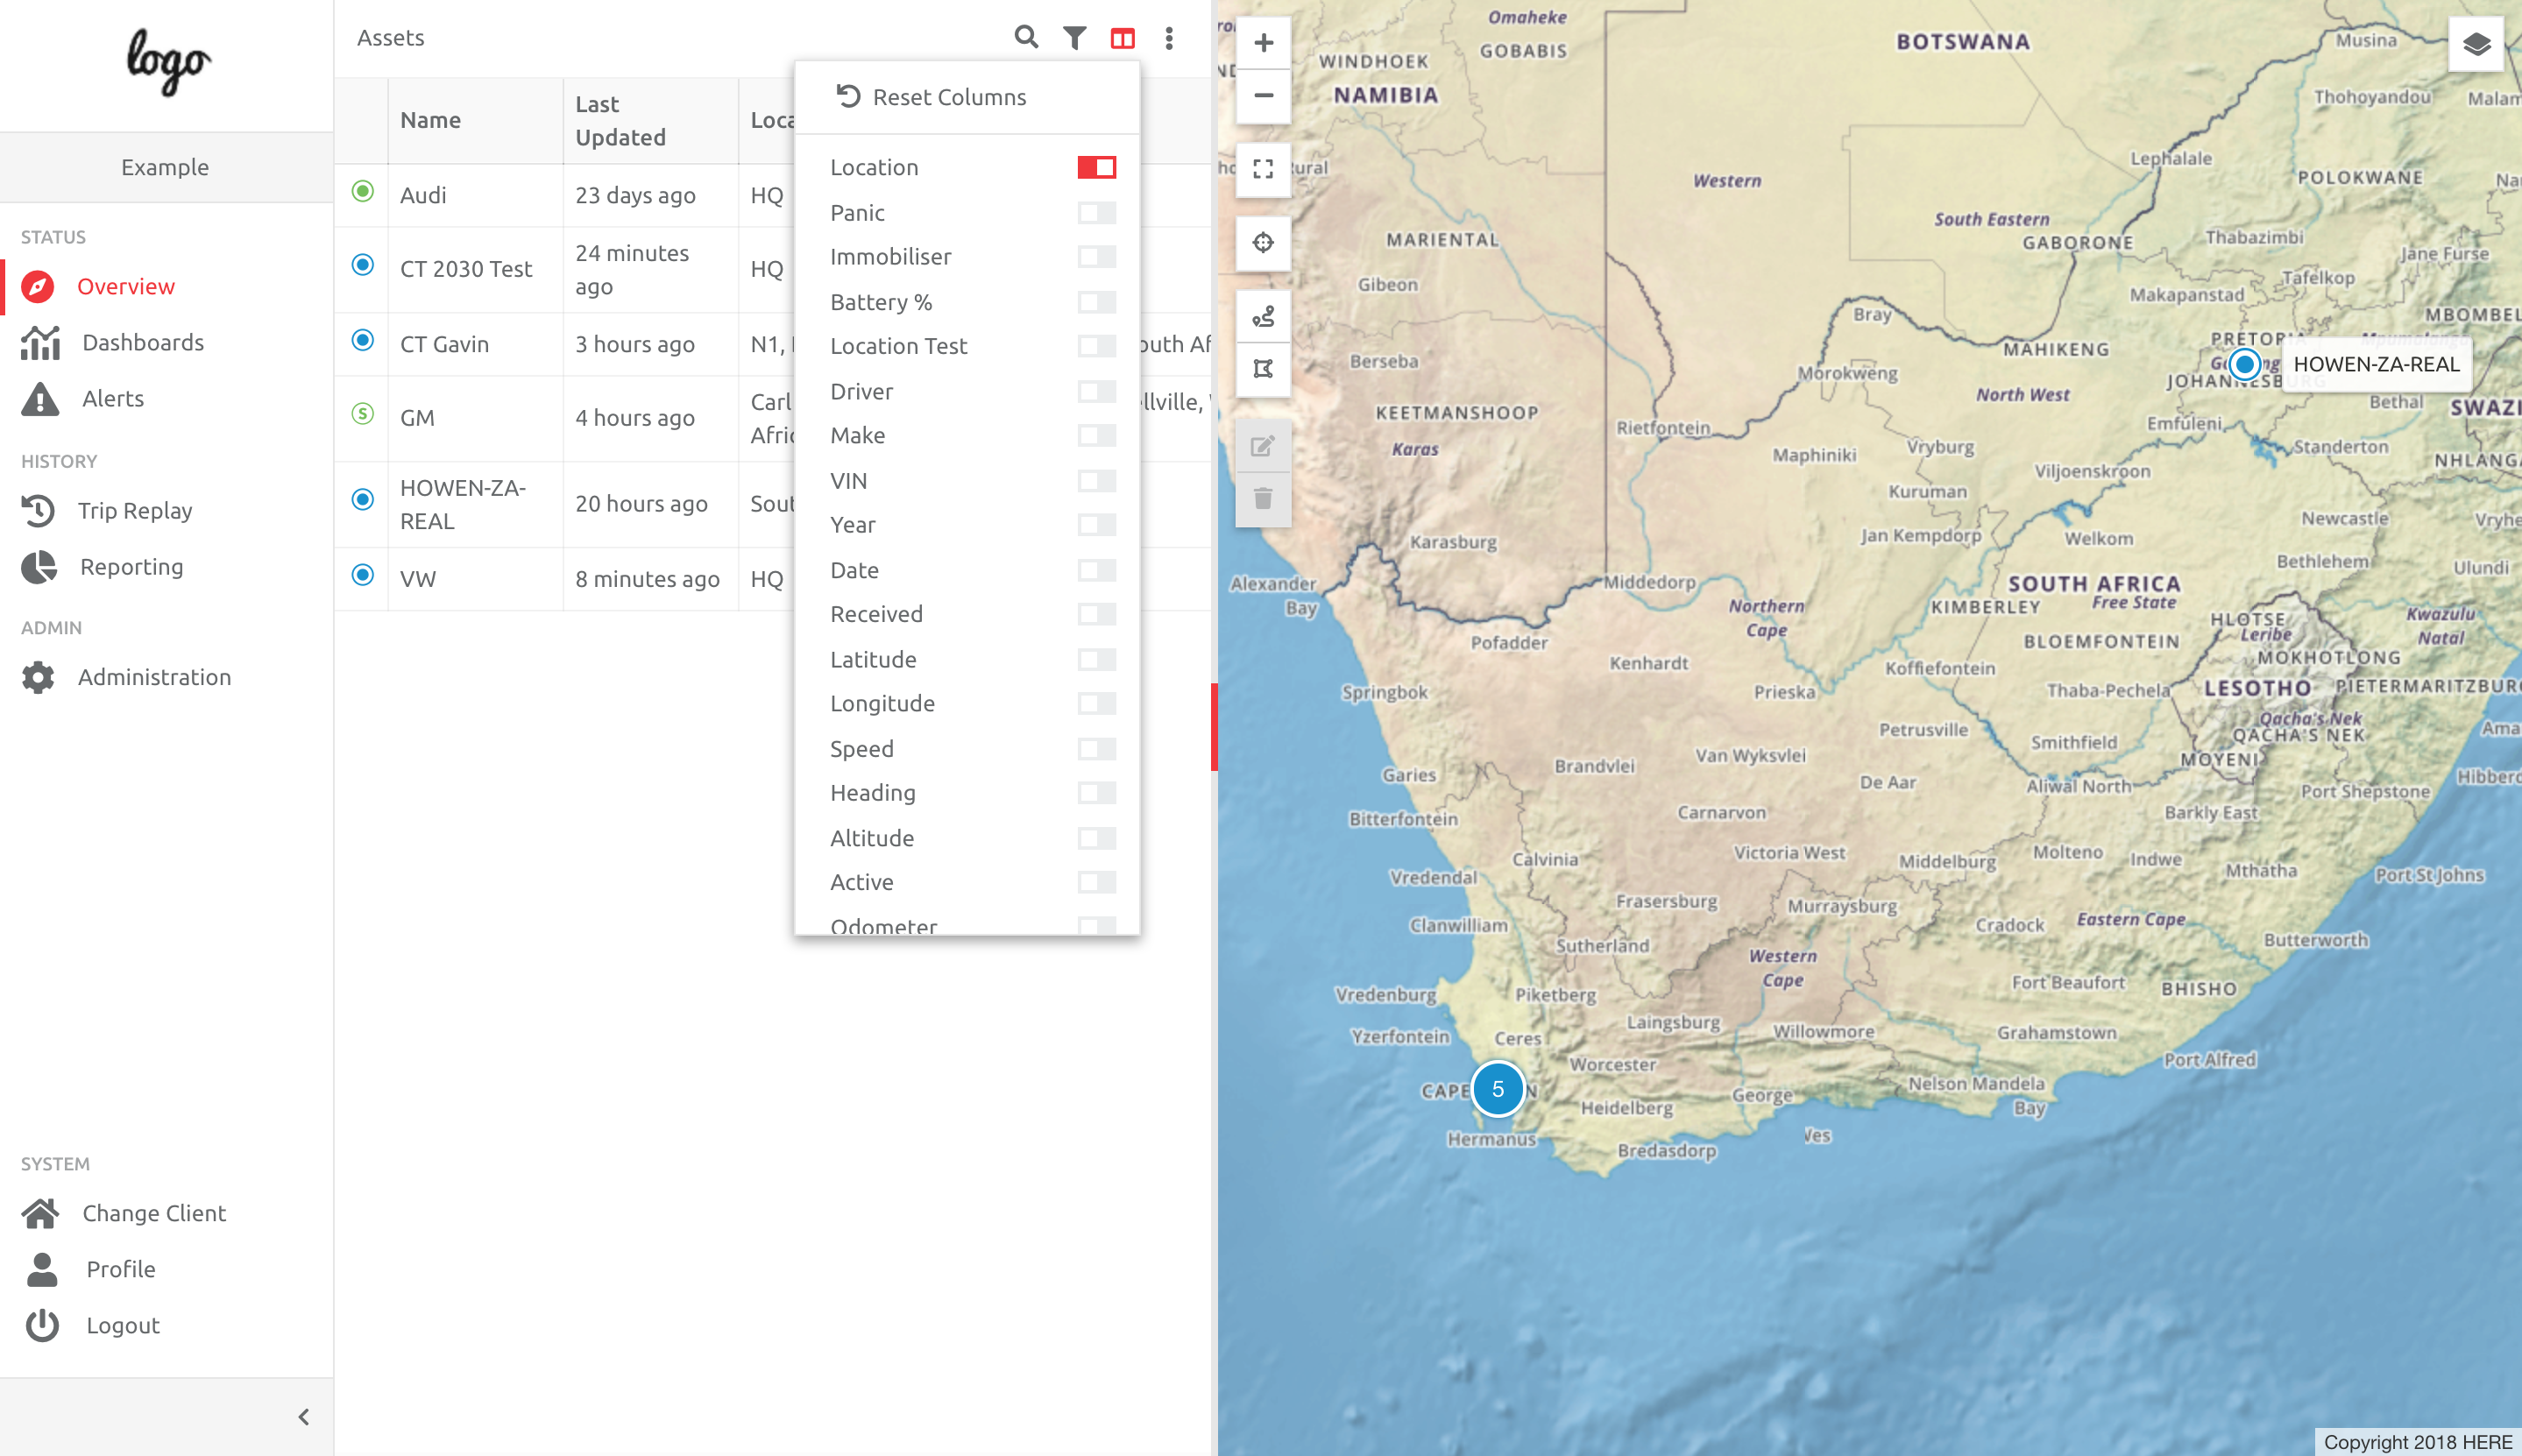
Next, choose the selector icon, and add the columns you would like to see, including Custom Fields, IO types and which Cost Centre, and/or Asset Group/s the Asset is in:
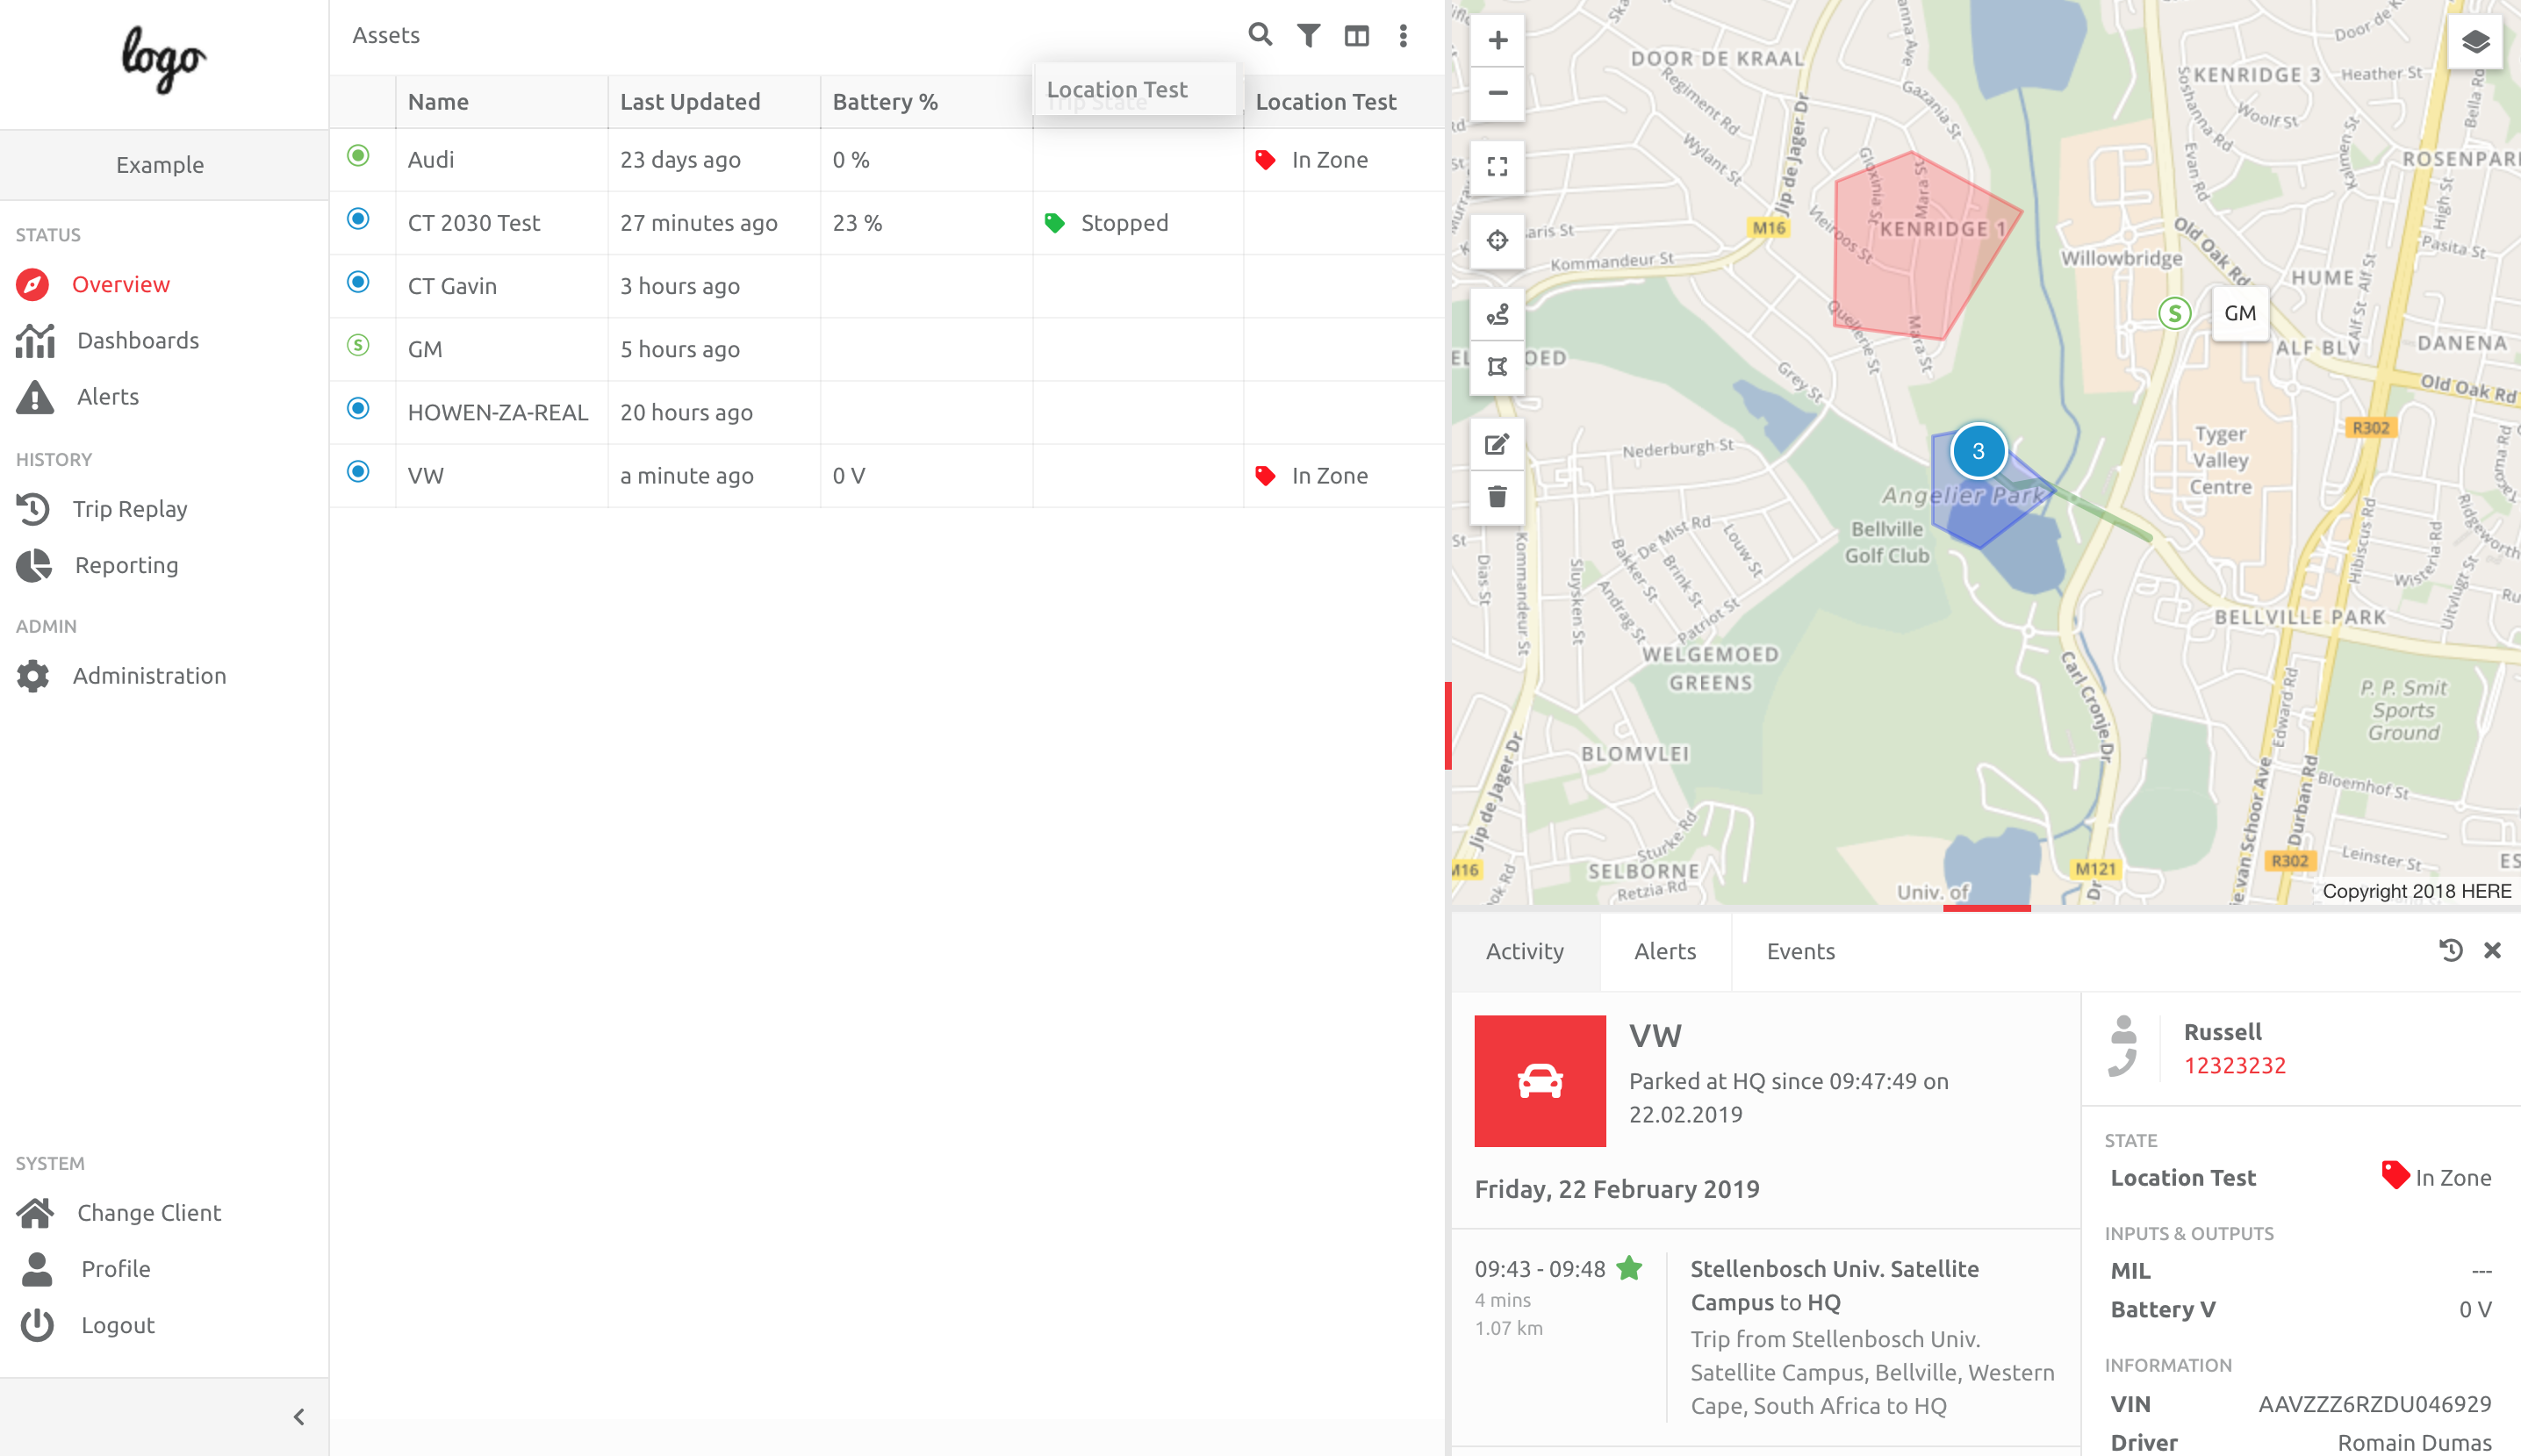
We have enabled two different States, as well as Battery %. Please note: Users can move columns around, and change the positions of the heading. In this screenshot we are moving Location Test to after Battery %:
Pinning and Hiding Telemetry Items
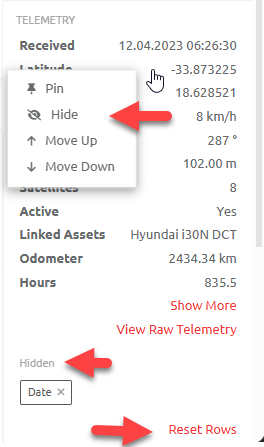
Users are able to pin, hide and arrange Telemetry Items on the Overview Screen. Please note the following:
- Pinning, hiding or re-arranging Telemetry items is Browser related, in other words,
- Changes made by a user will affect all clients when making use of the Browser in which the changes were made
- Changes will not be seen by other users unless they are using the same computer and browser
- Telemetry Items can be moved up or down the list
- The list can be reset to the default
Click on the Telemetry Item to view options:
- Pin
- Hide
- Move Up
- Move Down
Hiding or Displaying Assets on the Map
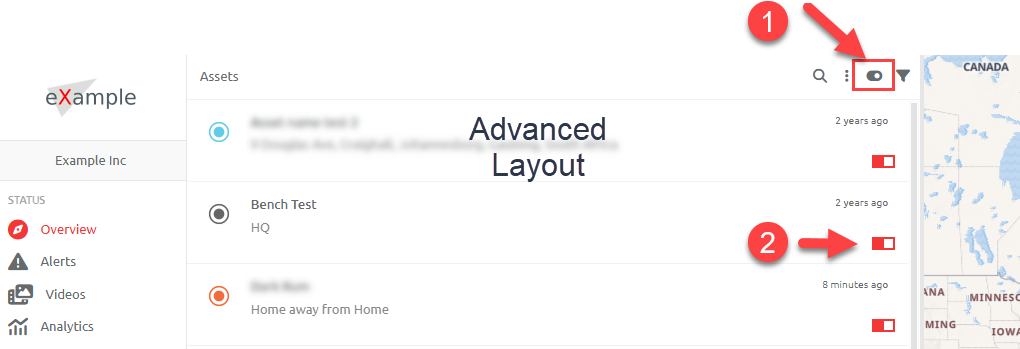
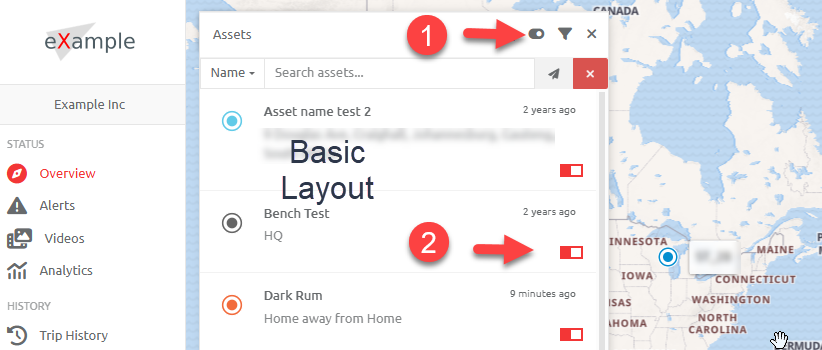
On the Overview page, and when Column View has been selected as above, "checkboxes" will be displayed which, when selected or deselected, will hide or display assets on the map accordingly.
- Available in Column View when Advanced Layout has been enabled on the Client, under Features - Overview Page - Layout - Advanced
- Also available when Basic Layout has been enabled on the Client, under Features - Overview Page - Layout - Basic
Please see the screenshot below, where the user is able to do the following:
- Show or Hide all Assets by selecting the "checkbox" at the top of the page.
- Show or Hide individual Assets by selecting the "checkbox" alongside the Asset
Changing the Asset Display Value
Users are able to change the Value of the Asset that is displayed on the map to any of the Custom Fields that are available for the Asset. In the example below the user has selected "VIN" to be displayed on the map instead of the Asset Name.
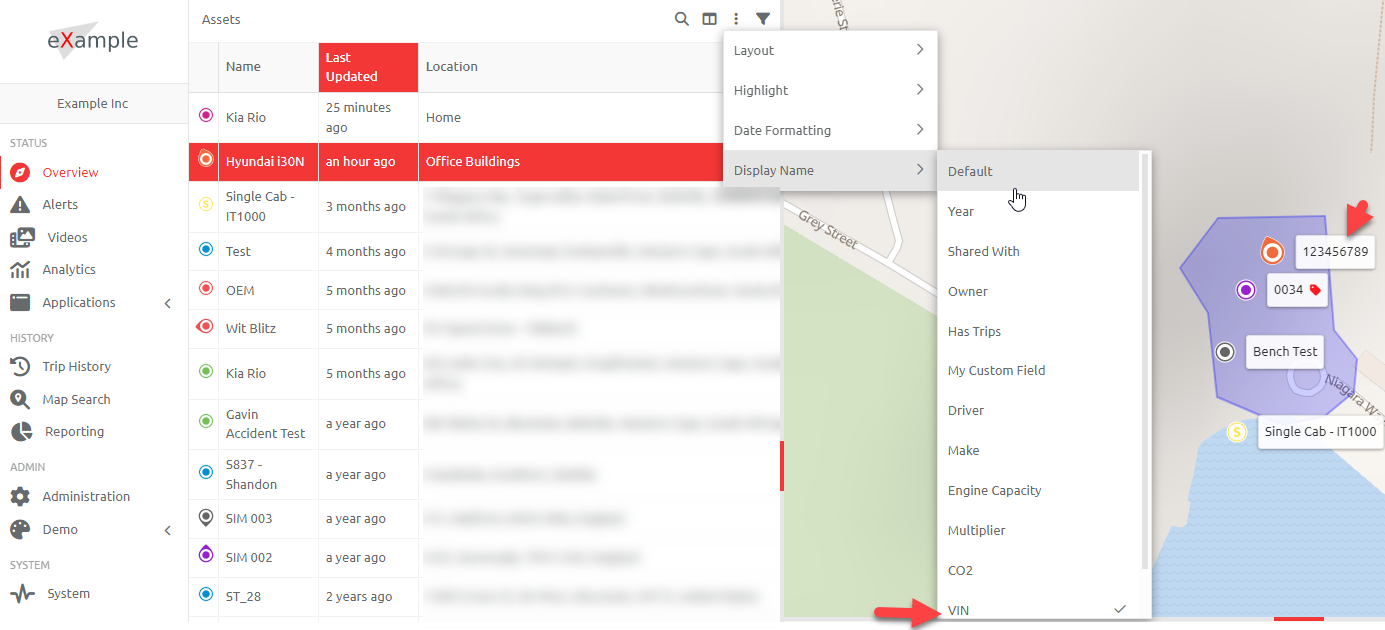
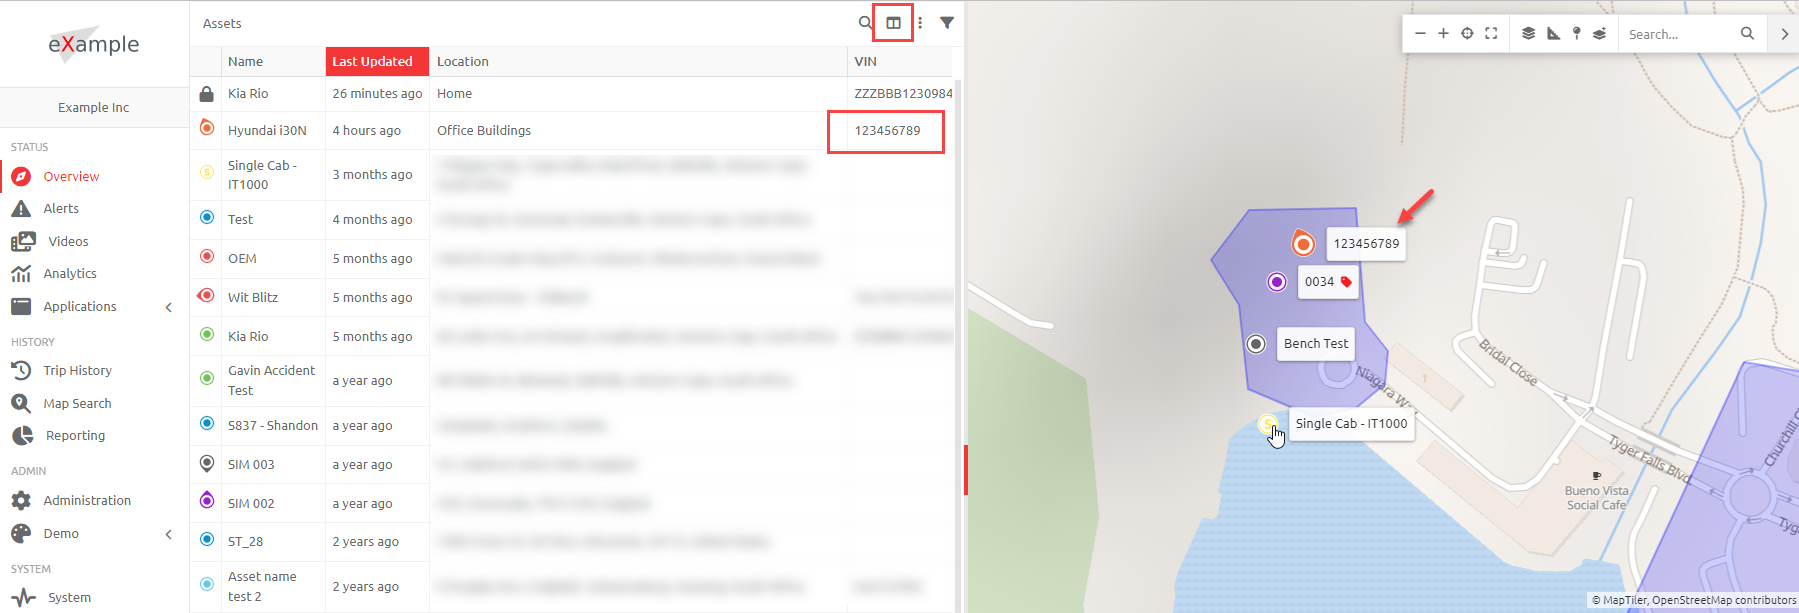
If Column View is selected on the Overview, then the Custom Field value that has been selected by the user will be provided in the Asset Name, with the original Asset Name in smaller text below it. In Grid View Please see screenshot.

If Grid View is selected on the Overview, then the Asset names will be displayed, with the ability to add the Custom field in the Grid. The Custom Field value will also be displayed on the map, as with the Column View.
Comments
0 comments
Please sign in to leave a comment.