Introduction
Alerts are created in the Administration Alerts section. They are viewed in the Status section, and the icons for each correspond to the priority set.
The platform groups alerts by position on the map, and the User can get a quick snapshot view of where Alerts are triggering, and identify patterns of behaviour. Alerts can be acknowledged, and/or commented on by Users. This allows a manager to identify if control room staff are watching and managing high priority Alerts.
Viewing Alerts
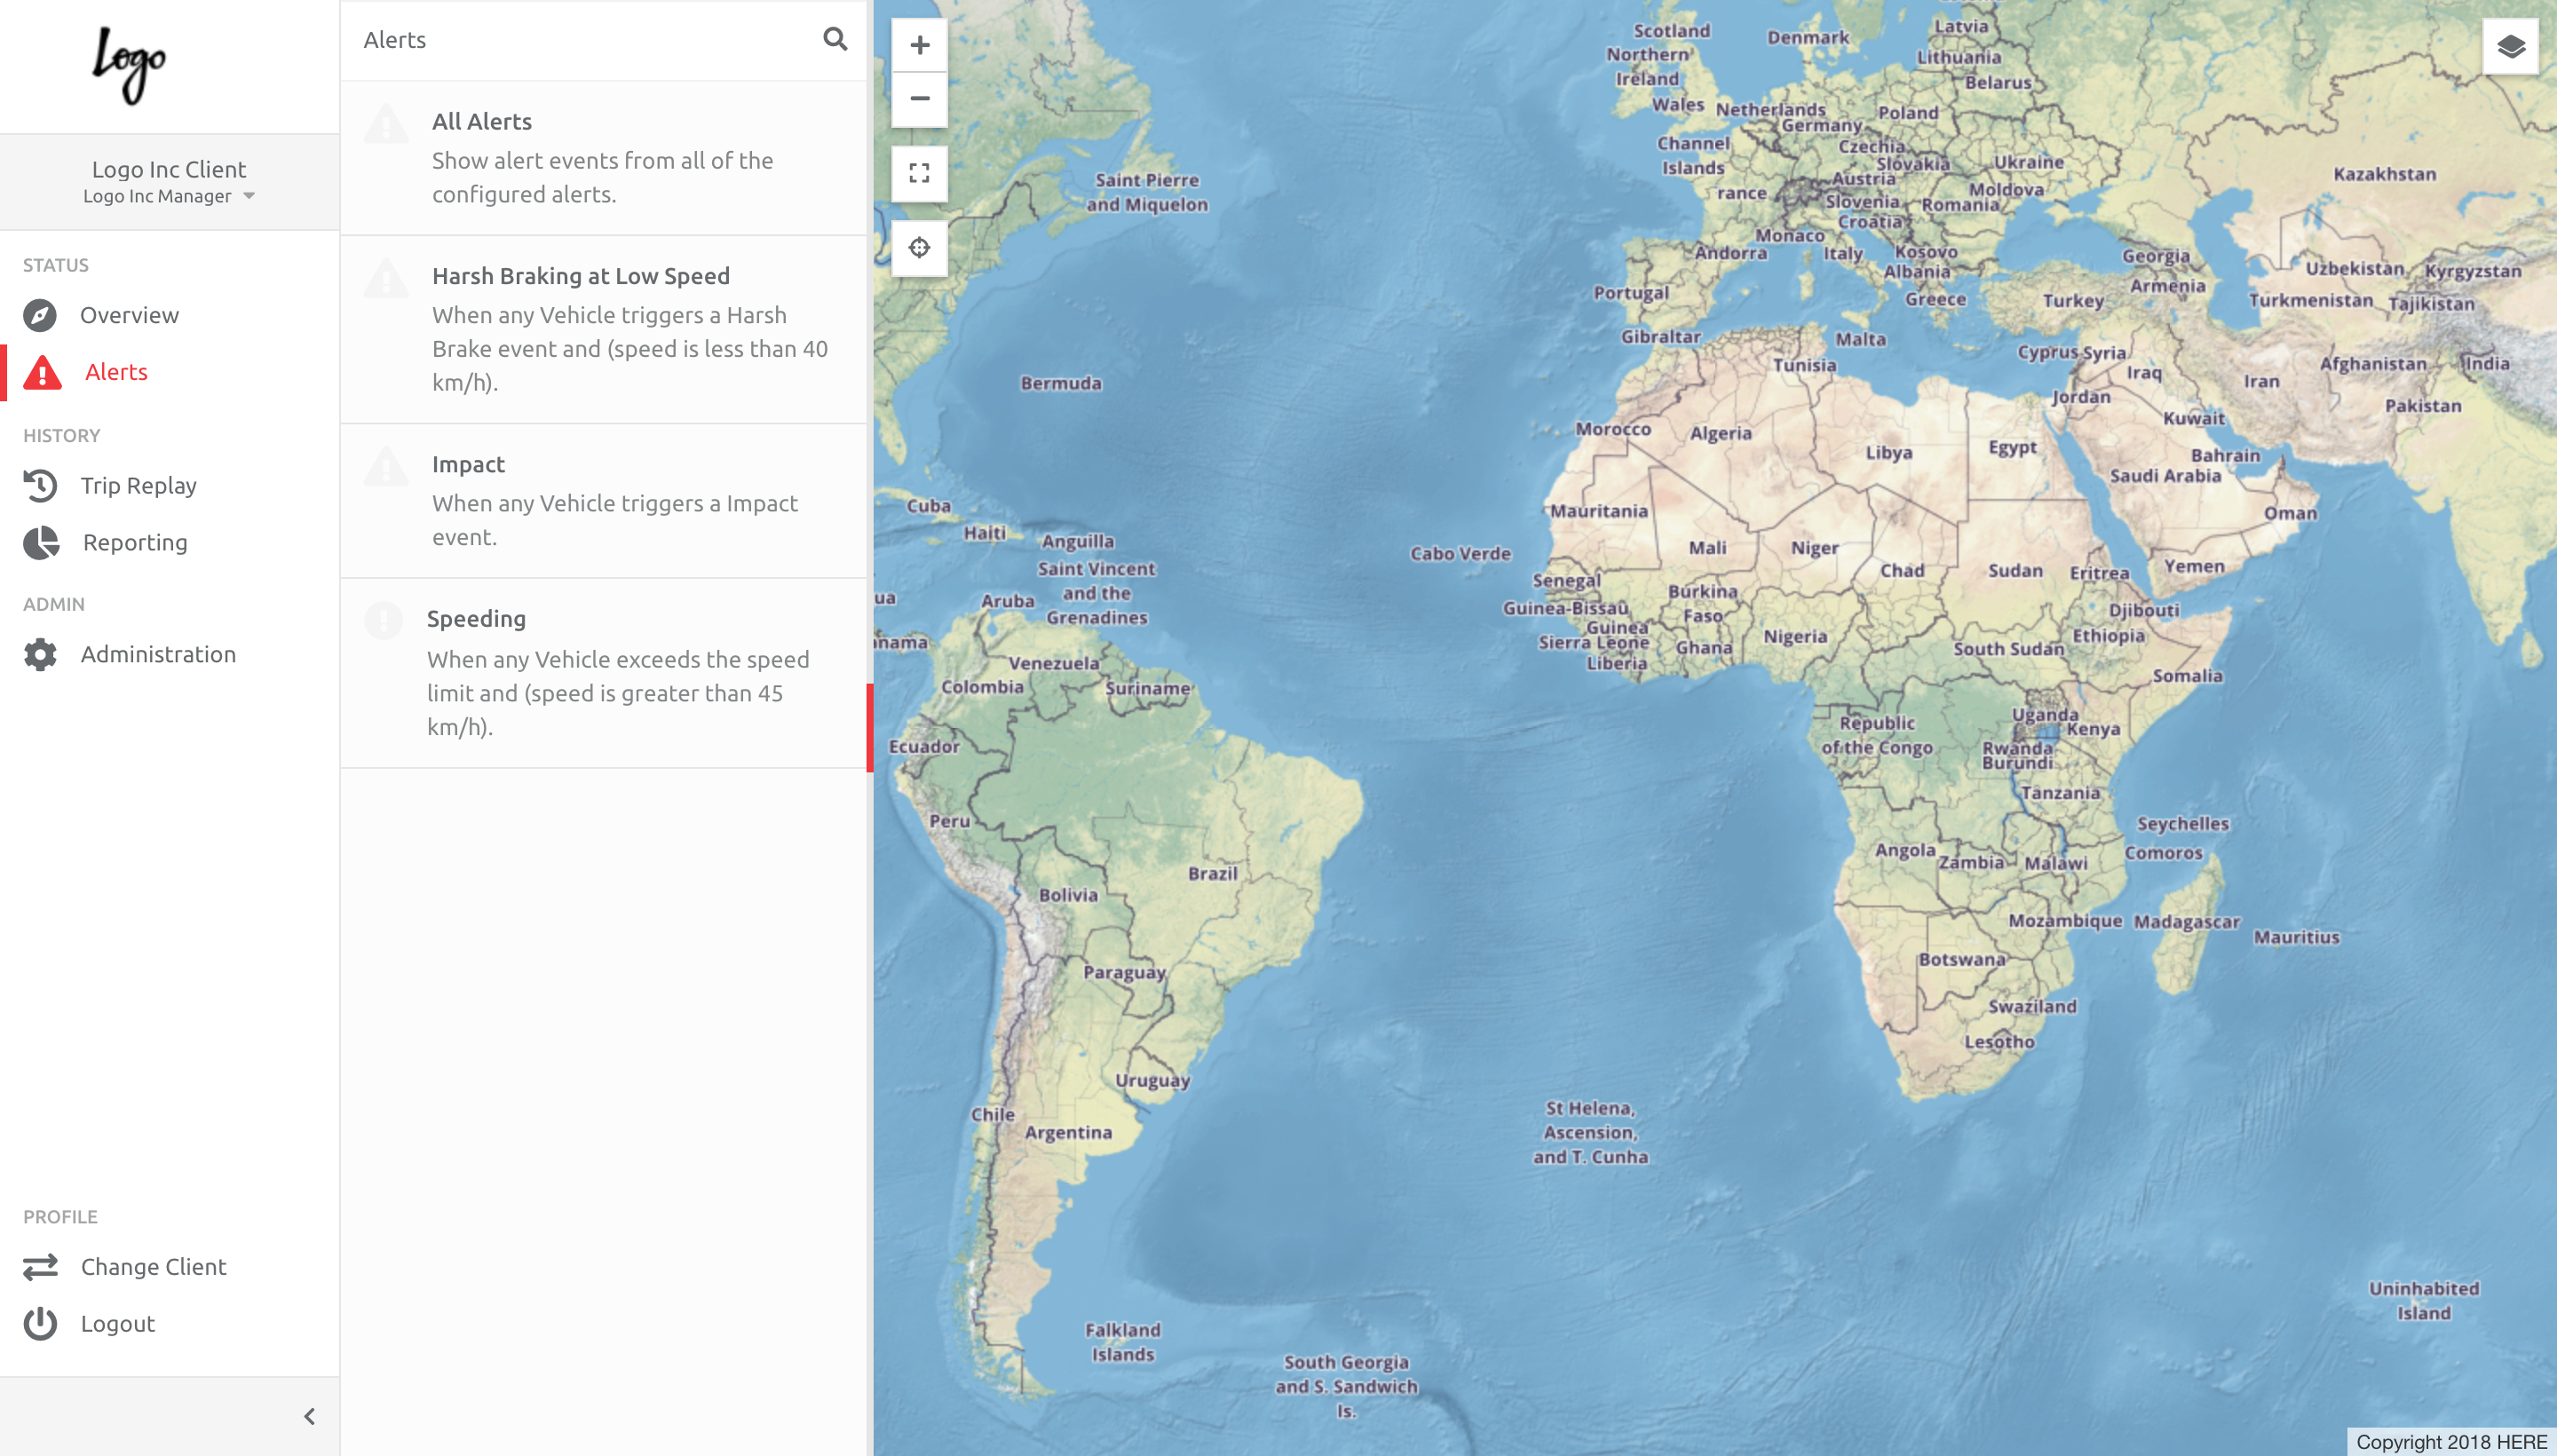
Navigate to Alerts under Status. The default screen will appear (Alerts list and map at GMT):
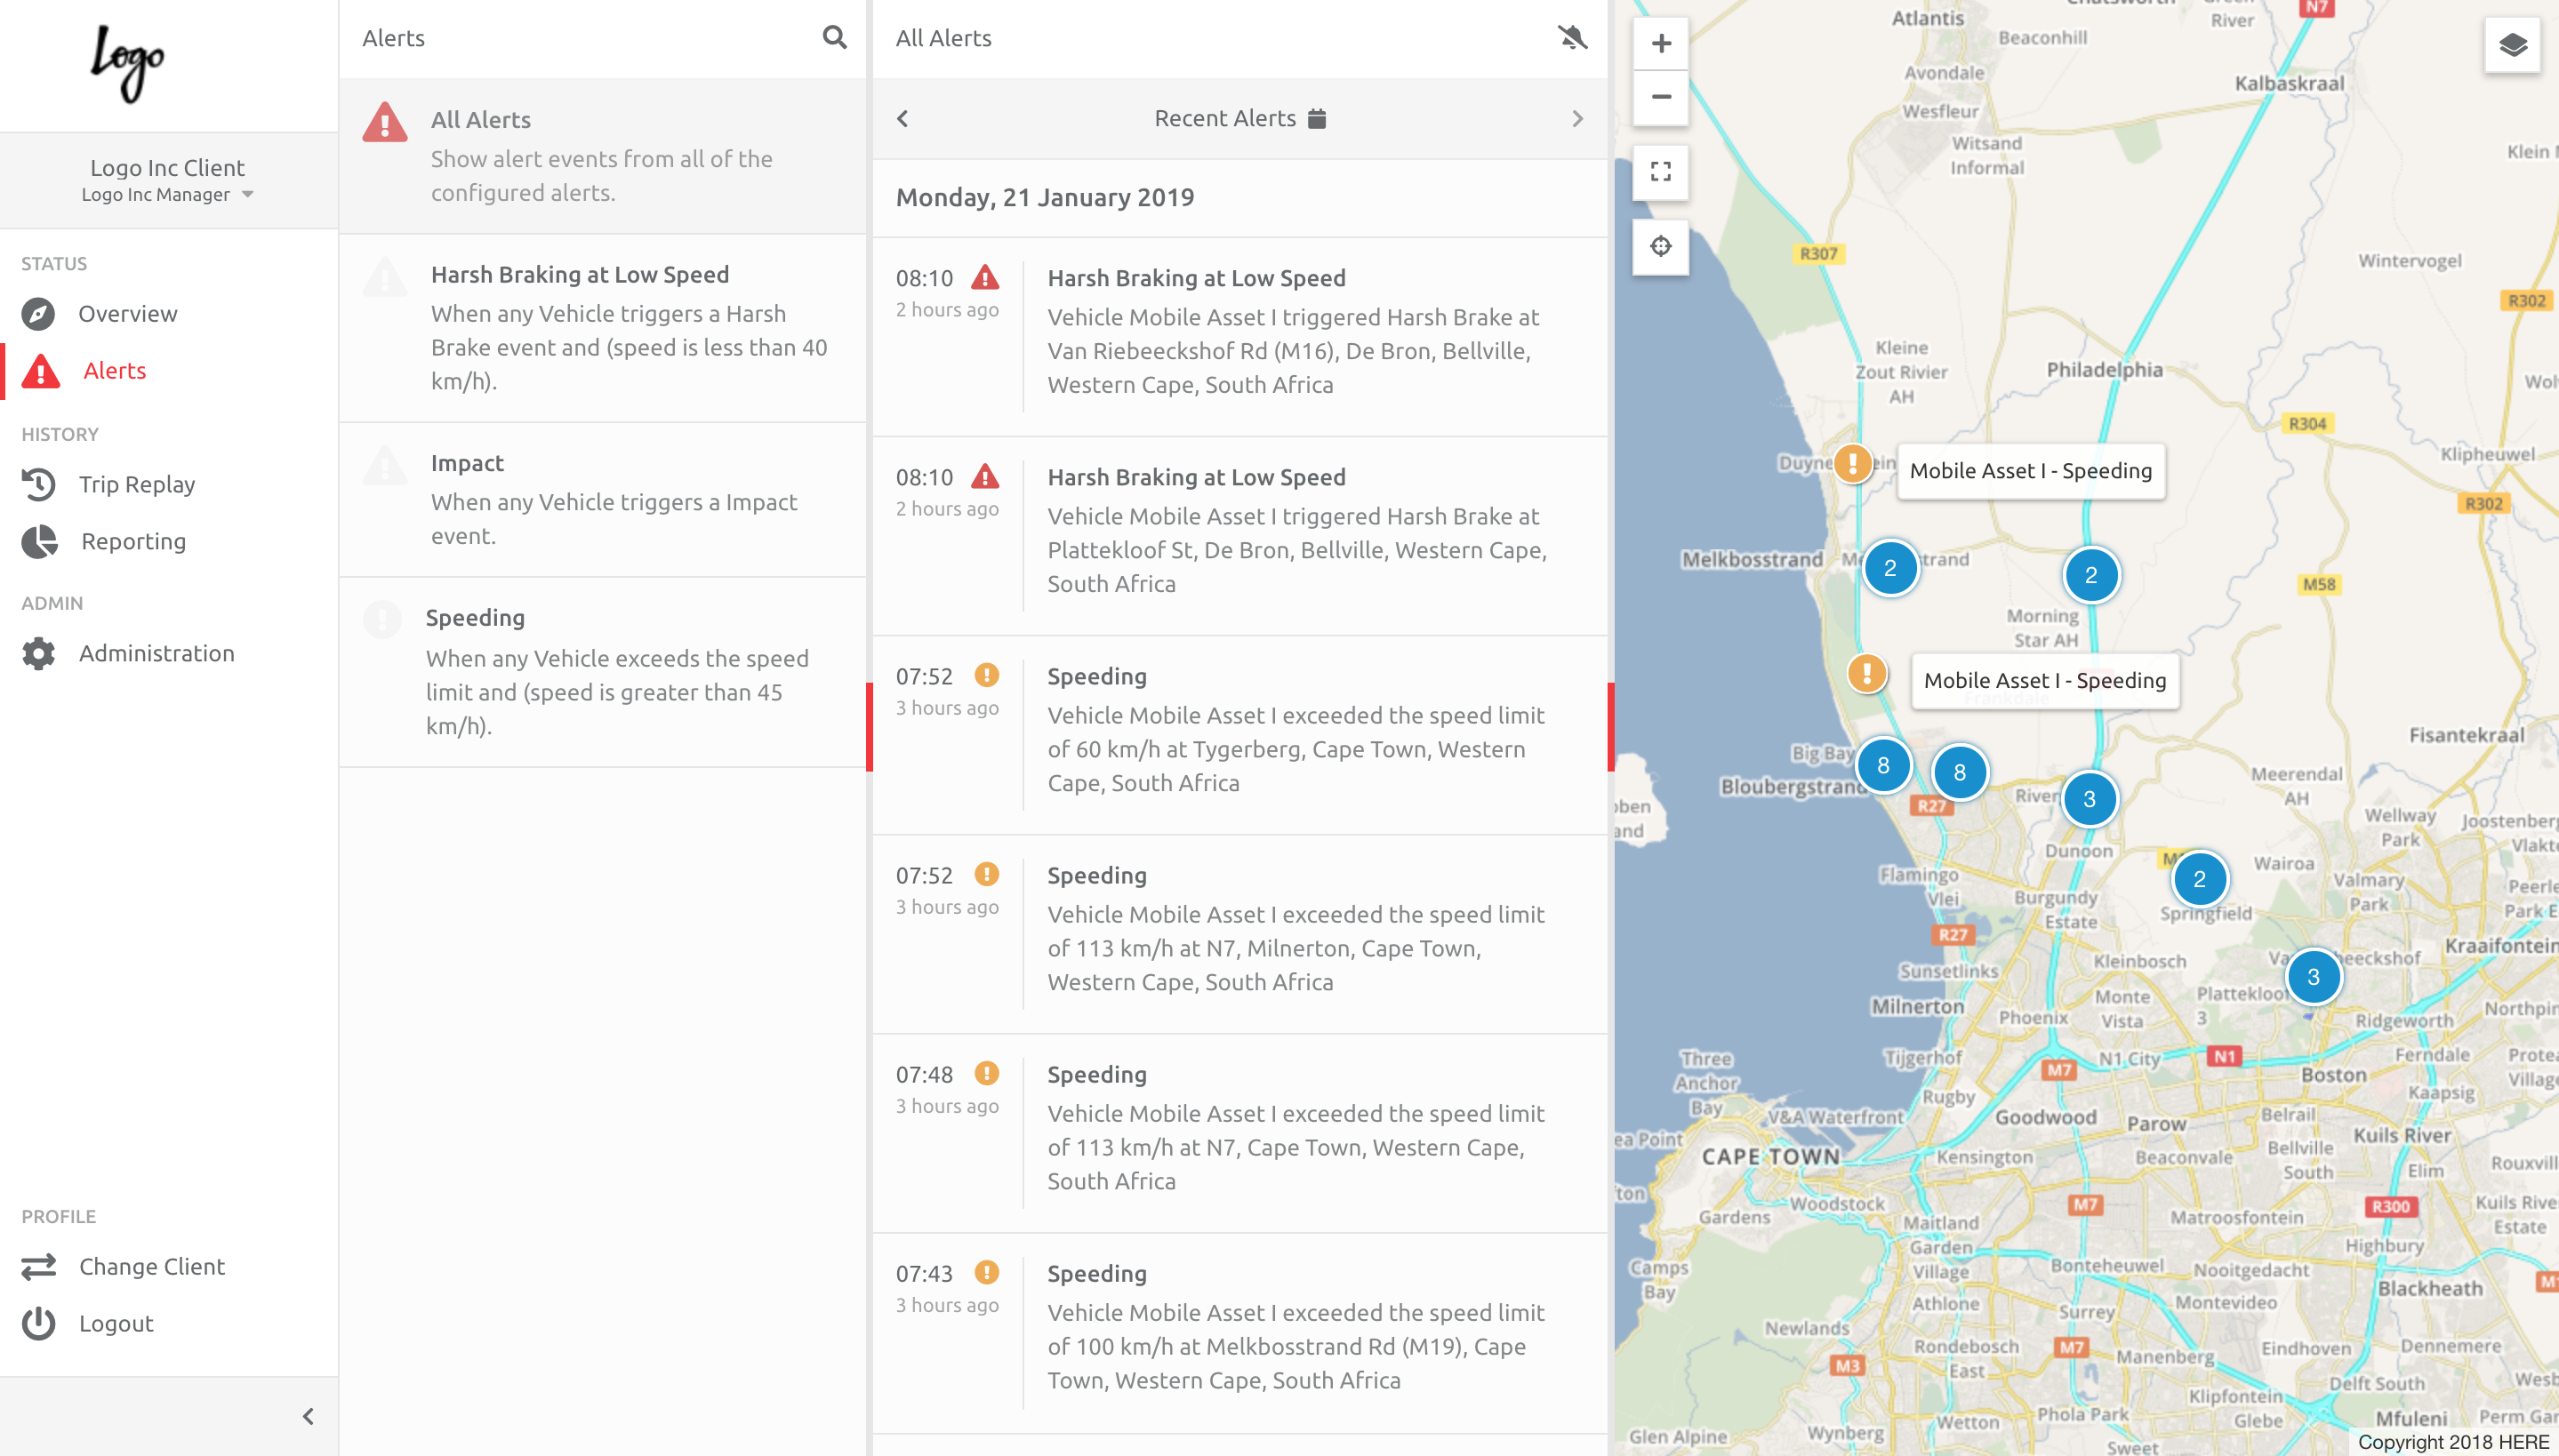
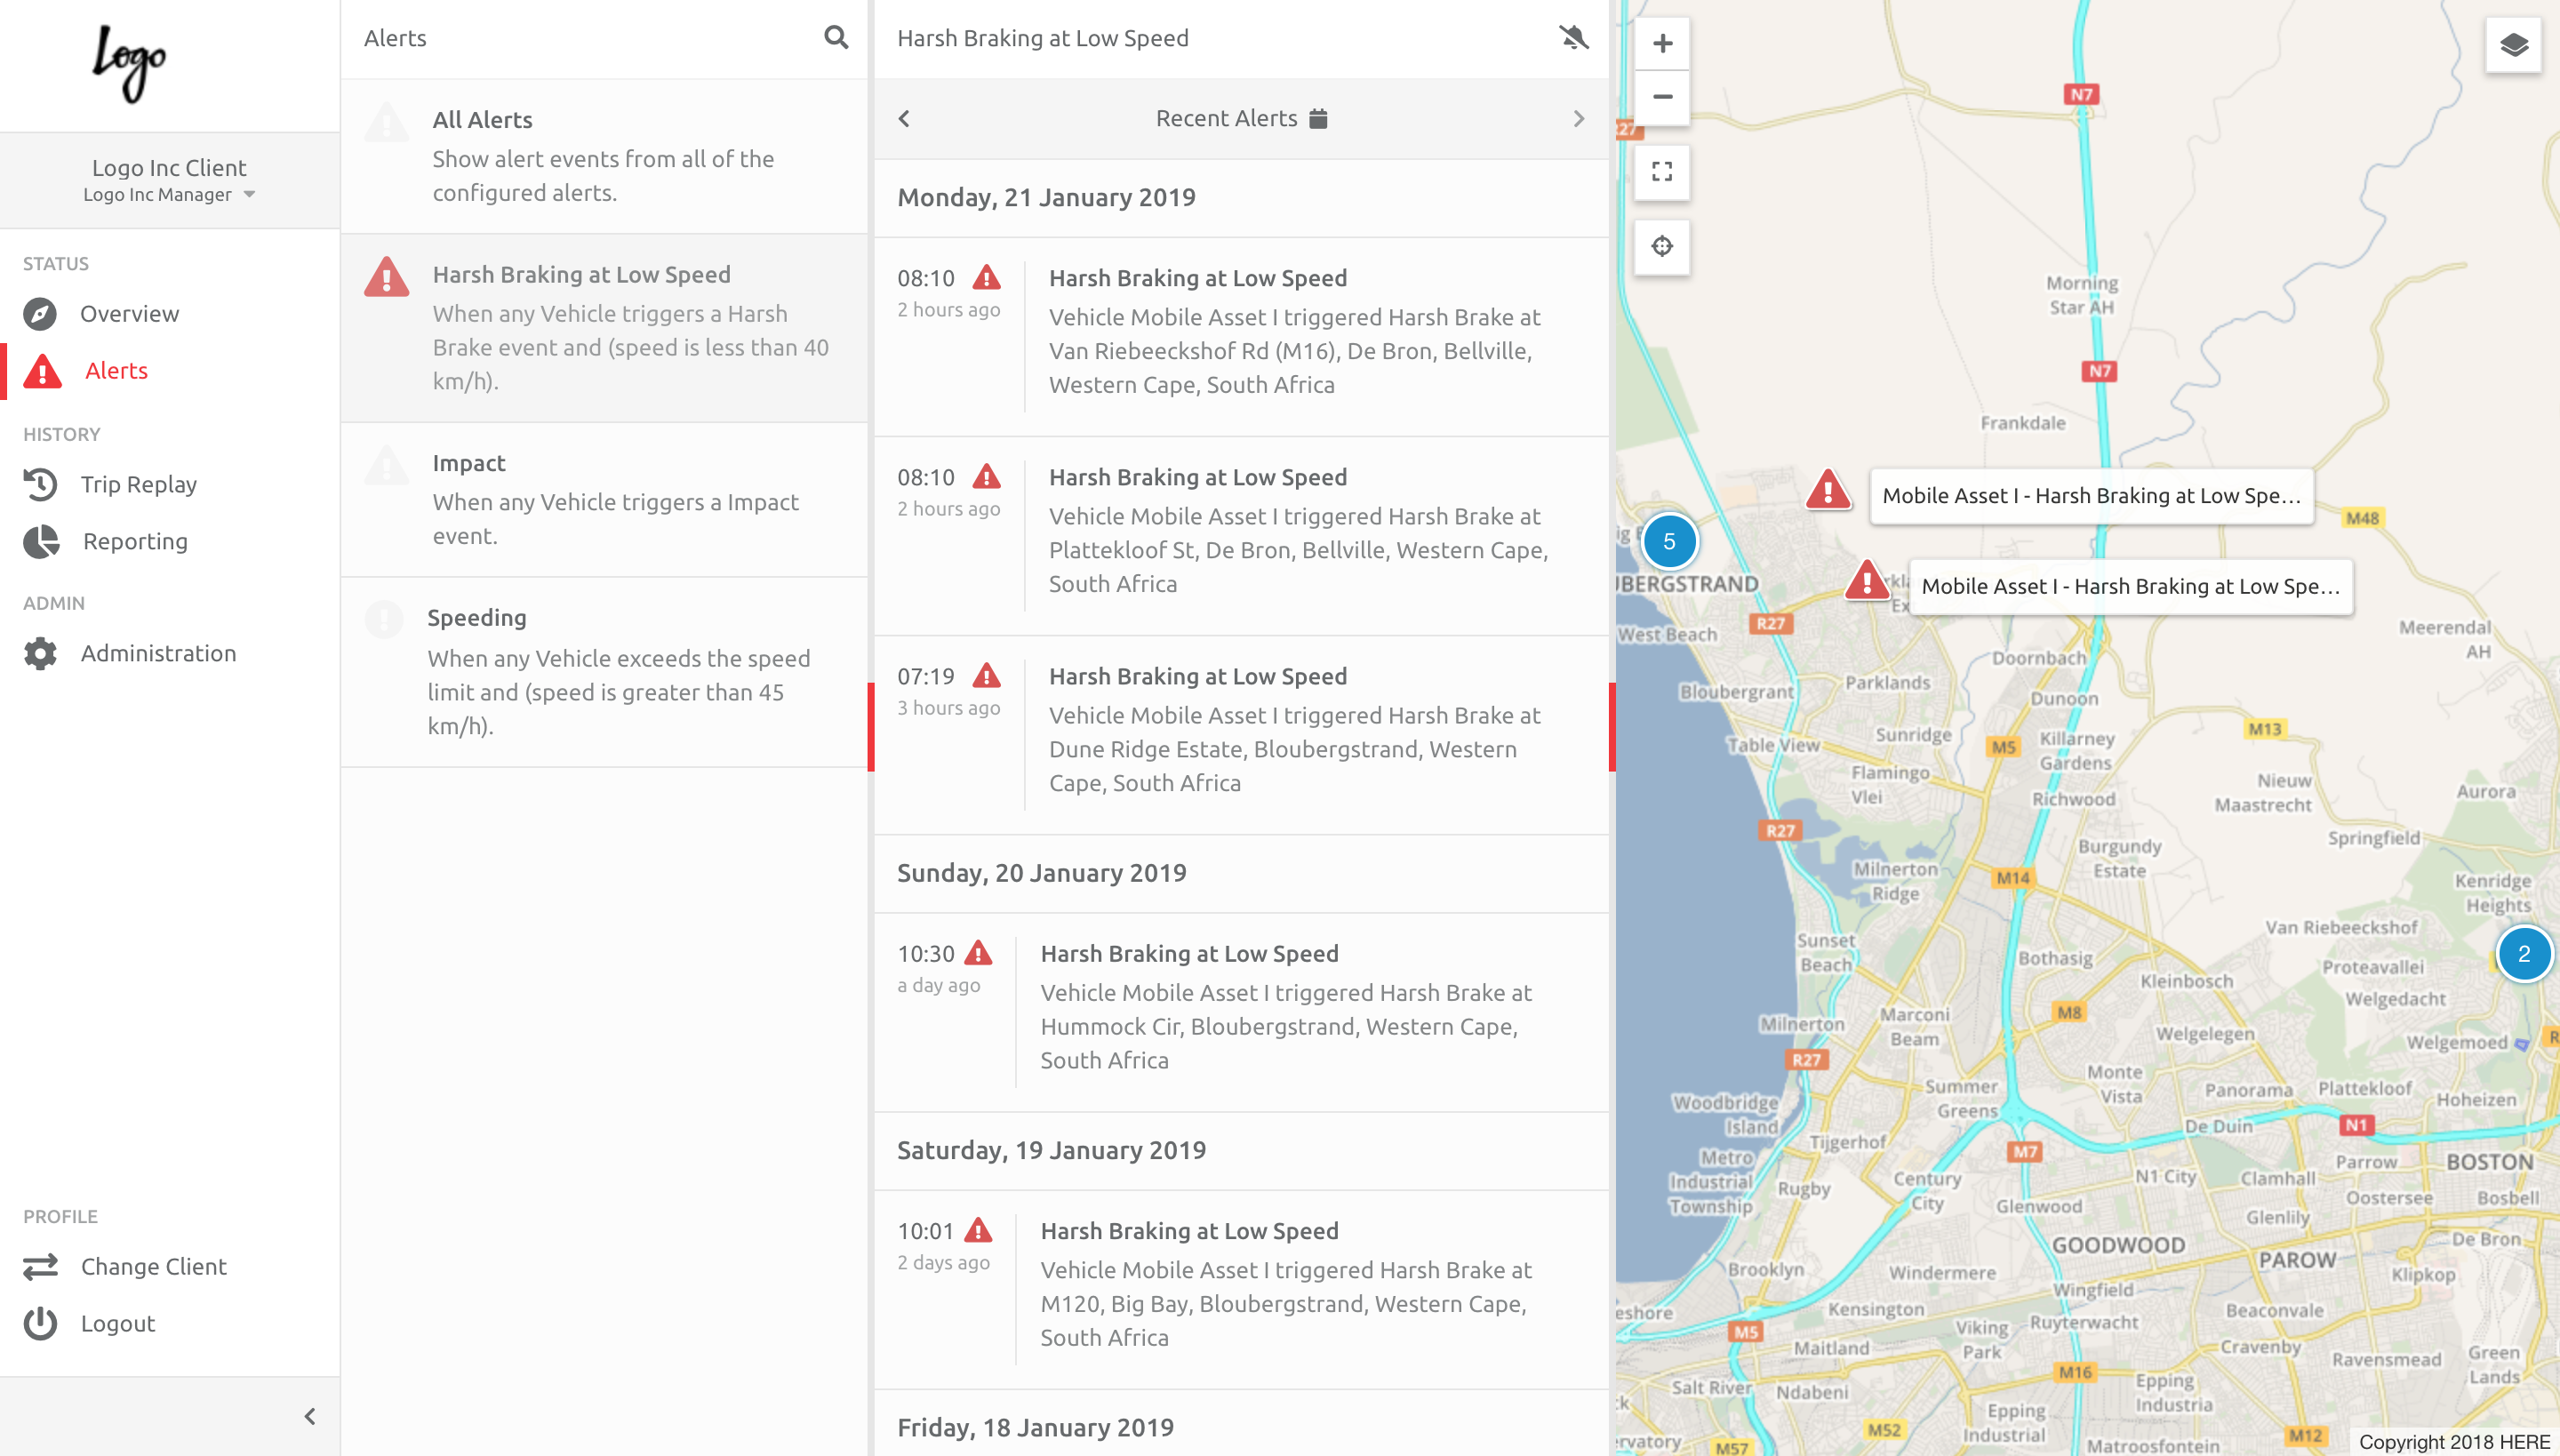
Choose All Alerts or a specific Alert to open the recently triggered ones on the map:
Users can also see what alerts make up the group on the map, by hovering your mouse over a group:
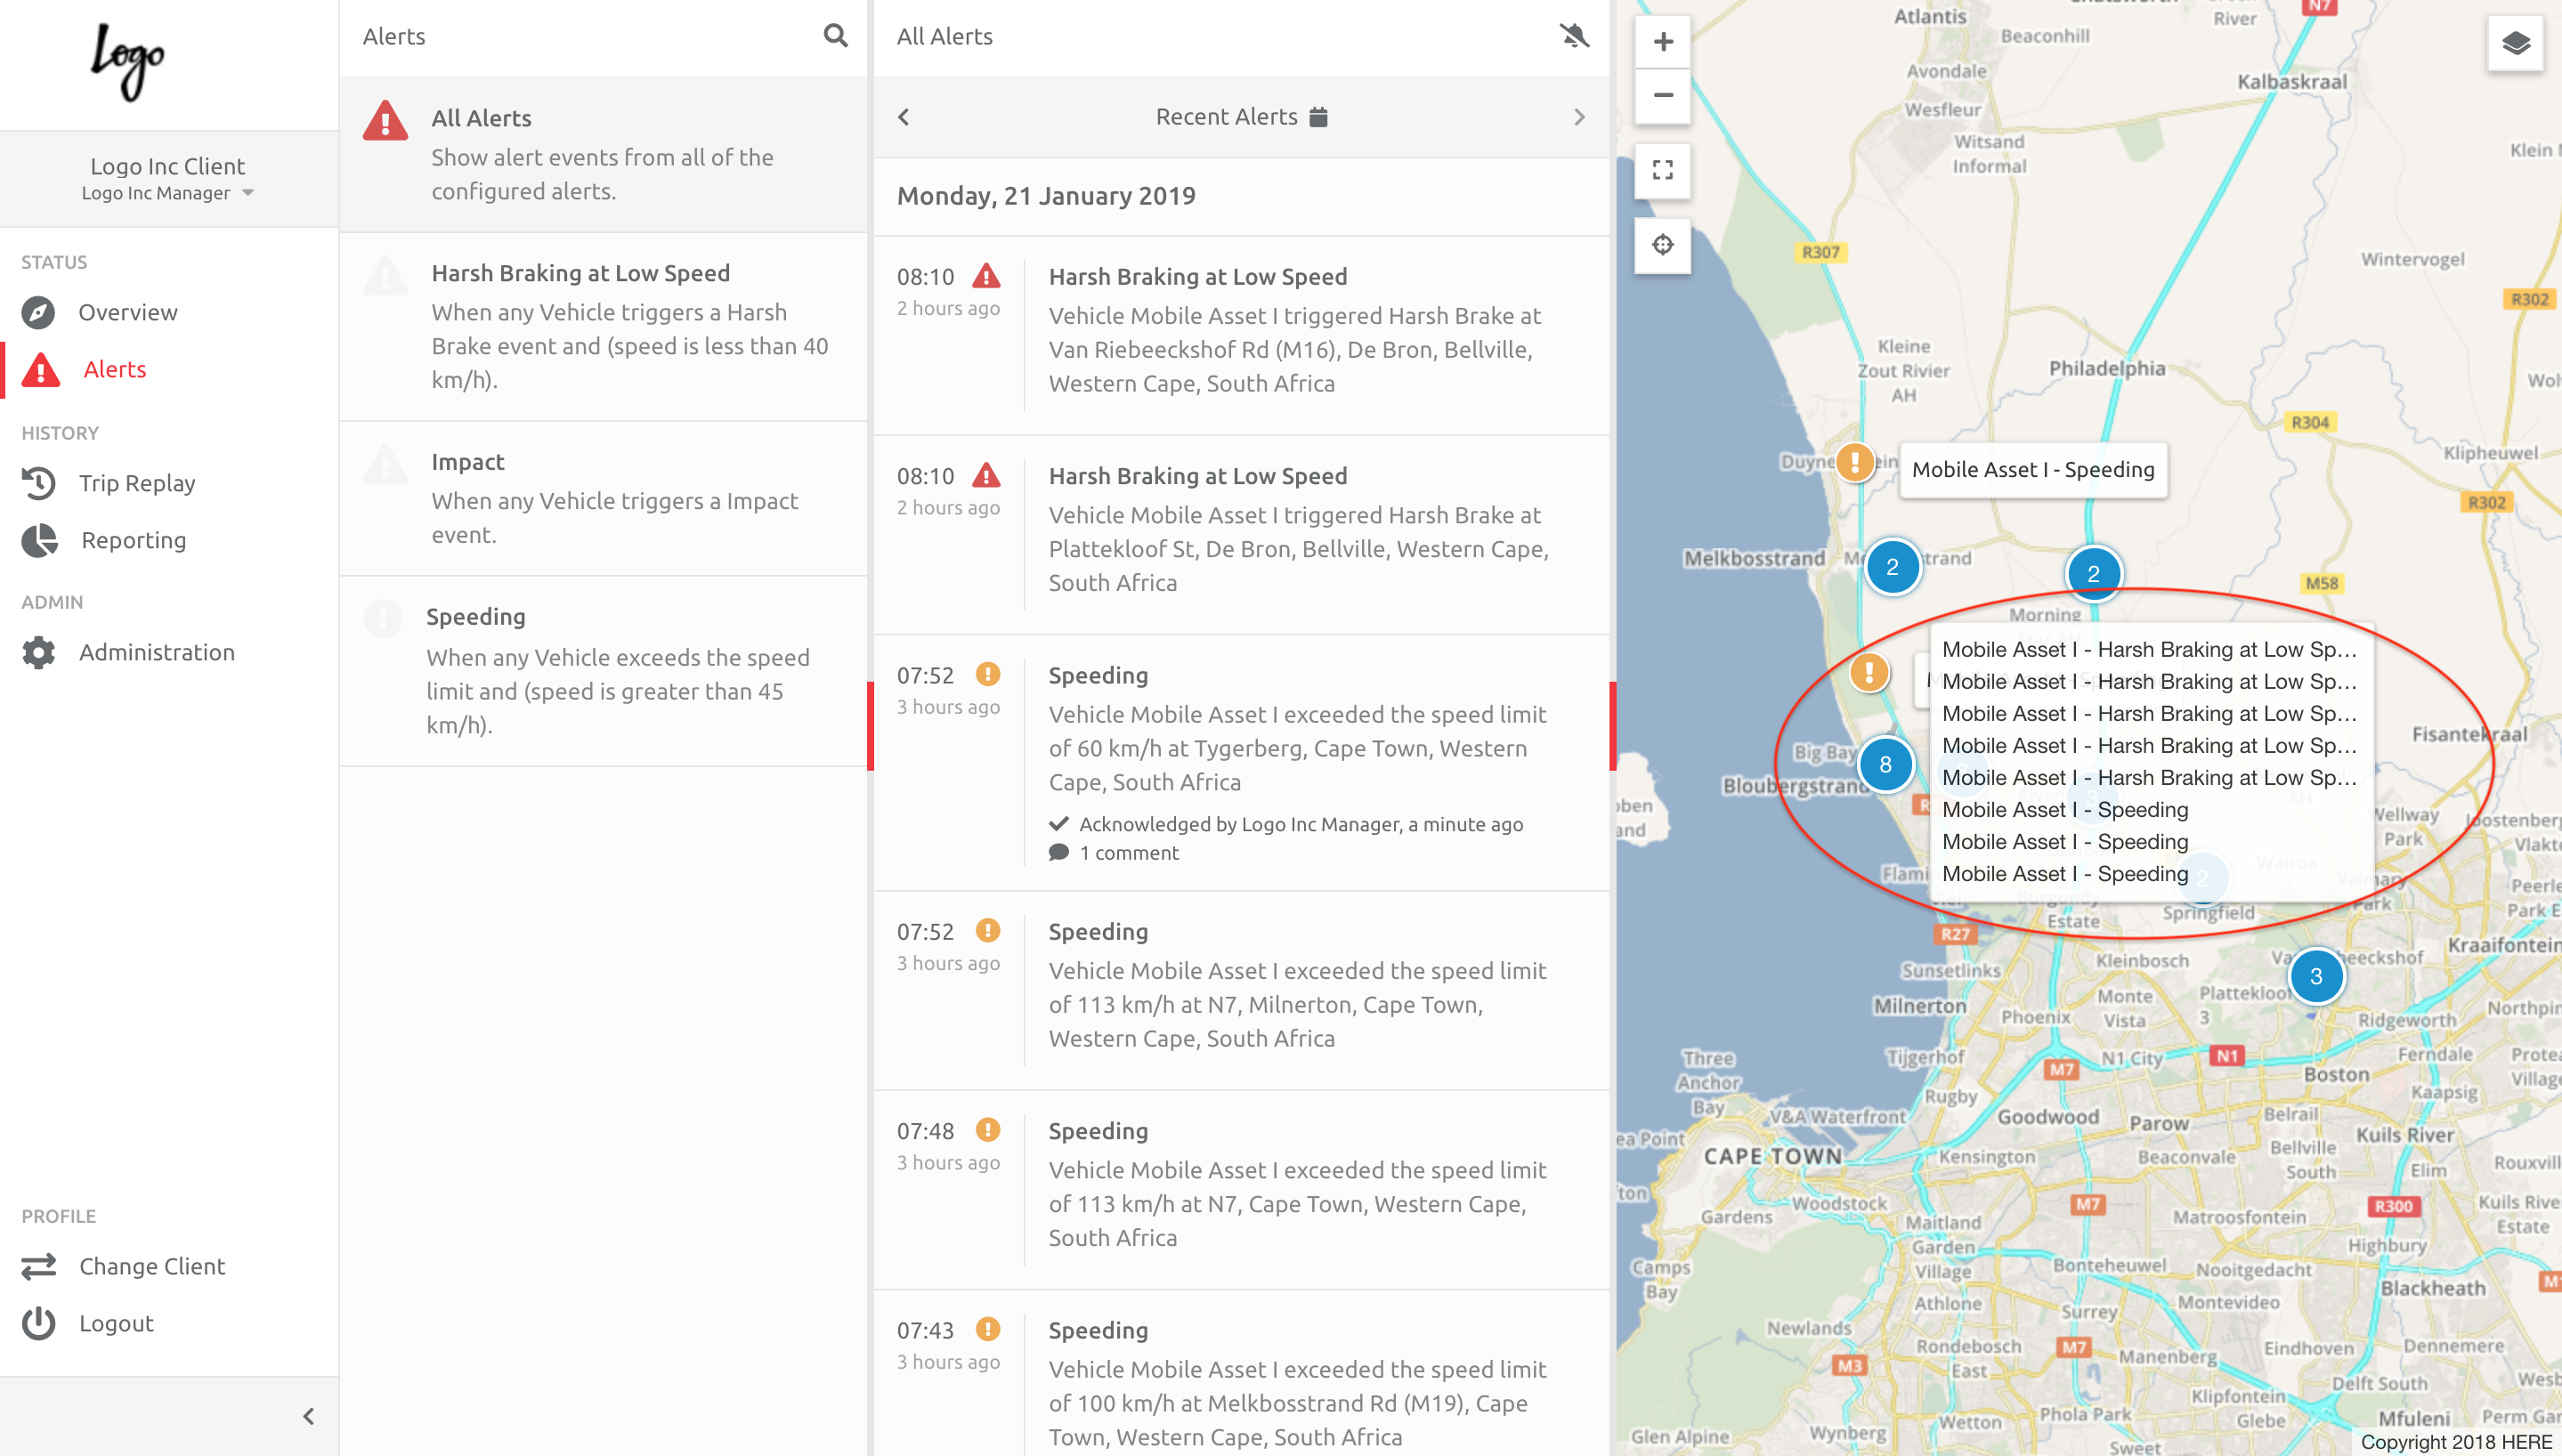
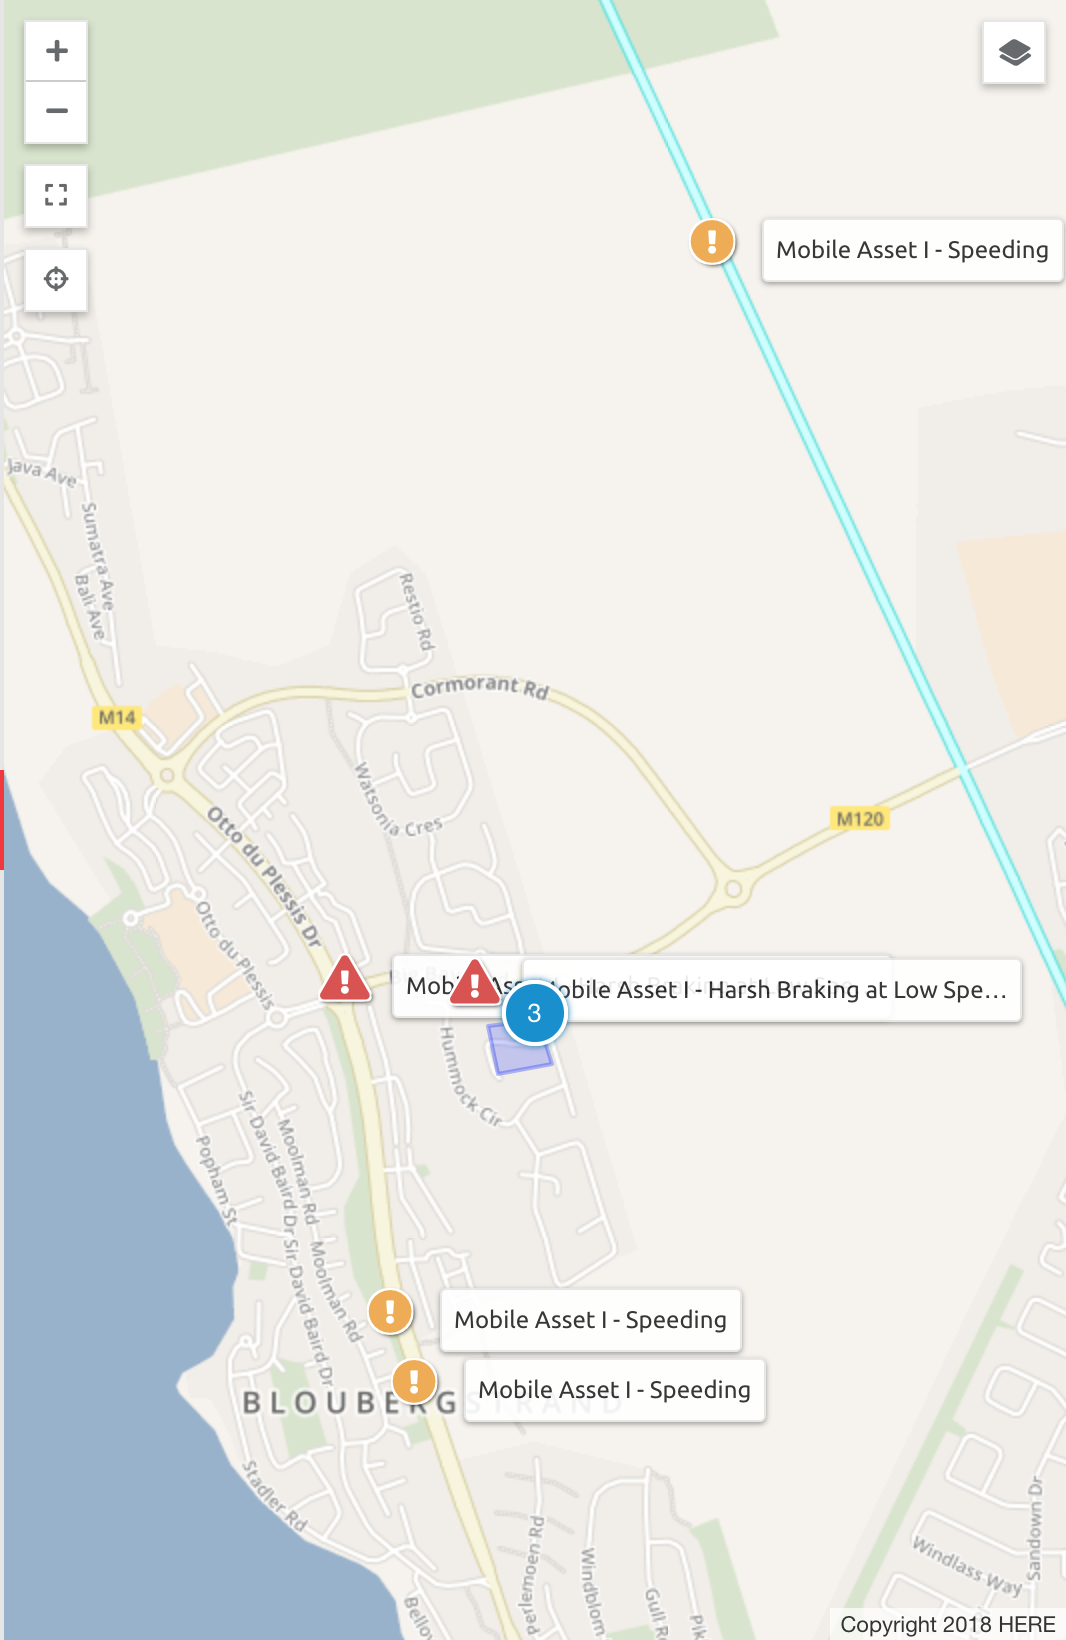
Clicking on the group will open the individual Alerts on the map:
Filtering Alerts by Dates
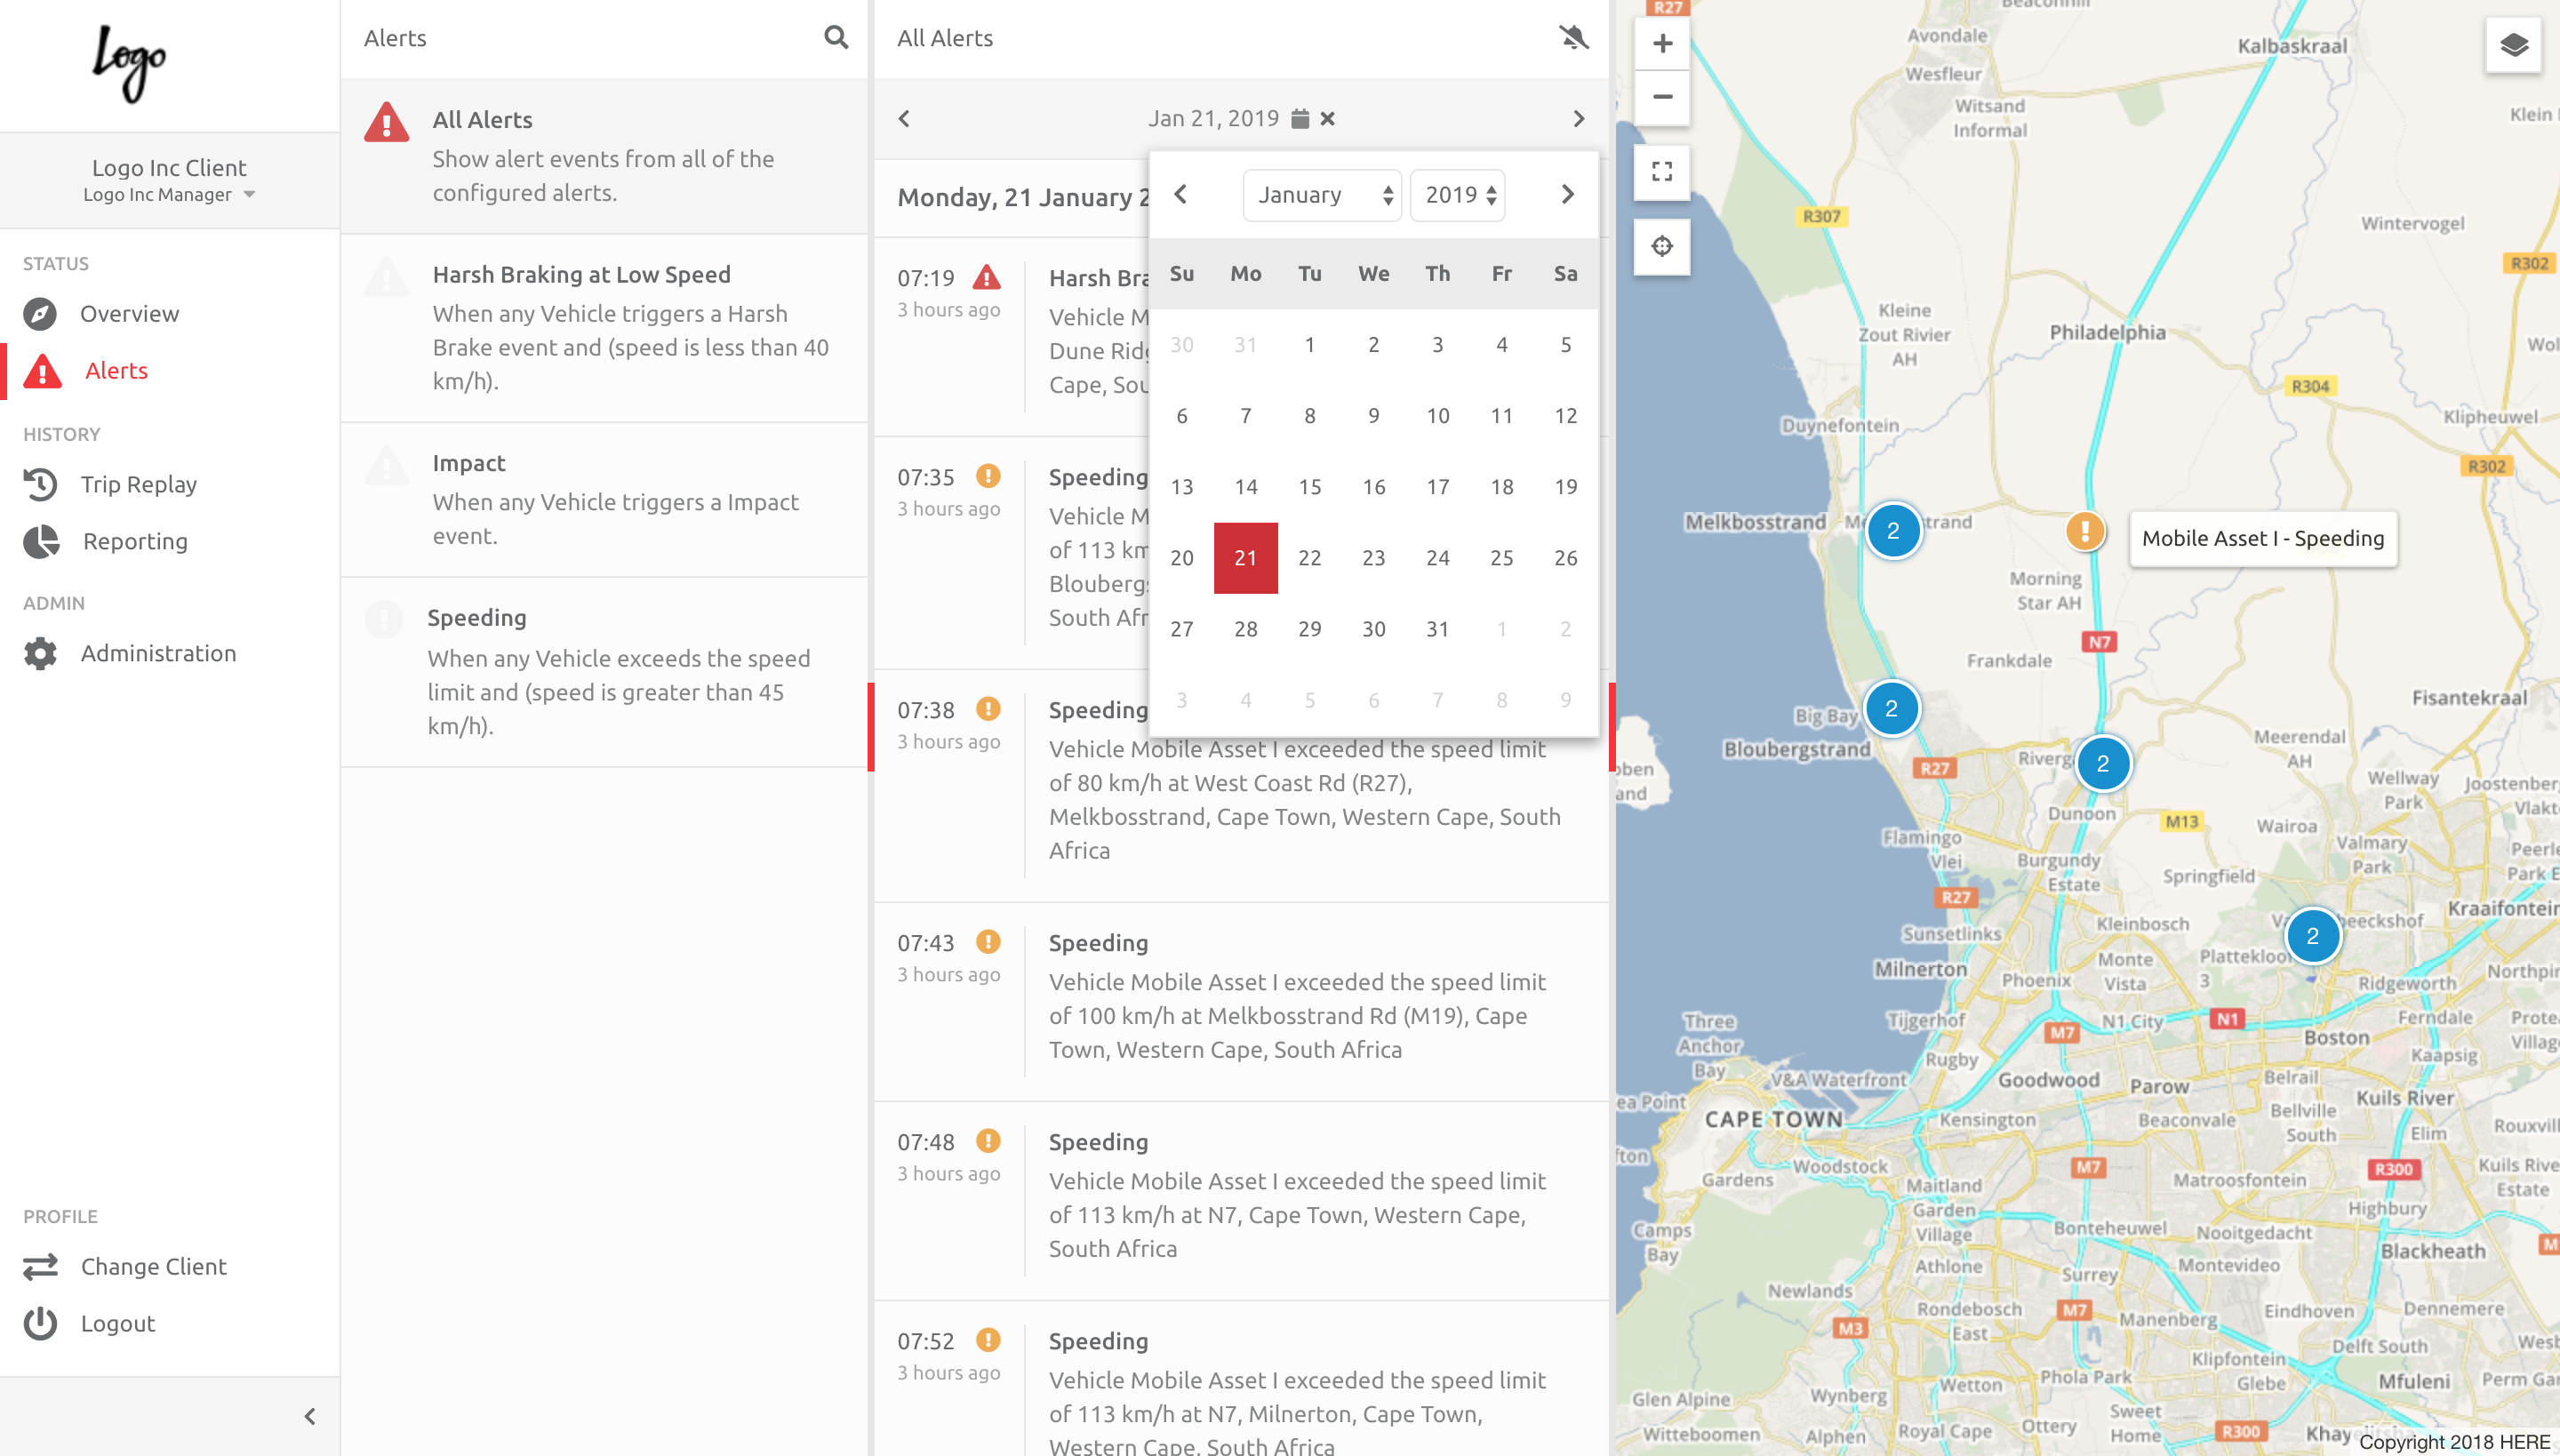
By default the recent Alerts are shown on the screen. To filter to a date, choose the date picker at the top of the Alert list to choose a specific date.
Comments
0 comments
Please sign in to leave a comment.