Introduction
Multiple events can occur during a trip, from speeding, entering and leaving locations etc. The way trips are displayed, as well as the data grouped, helps the User quickly identify what and where these events occurred.
Visual Display
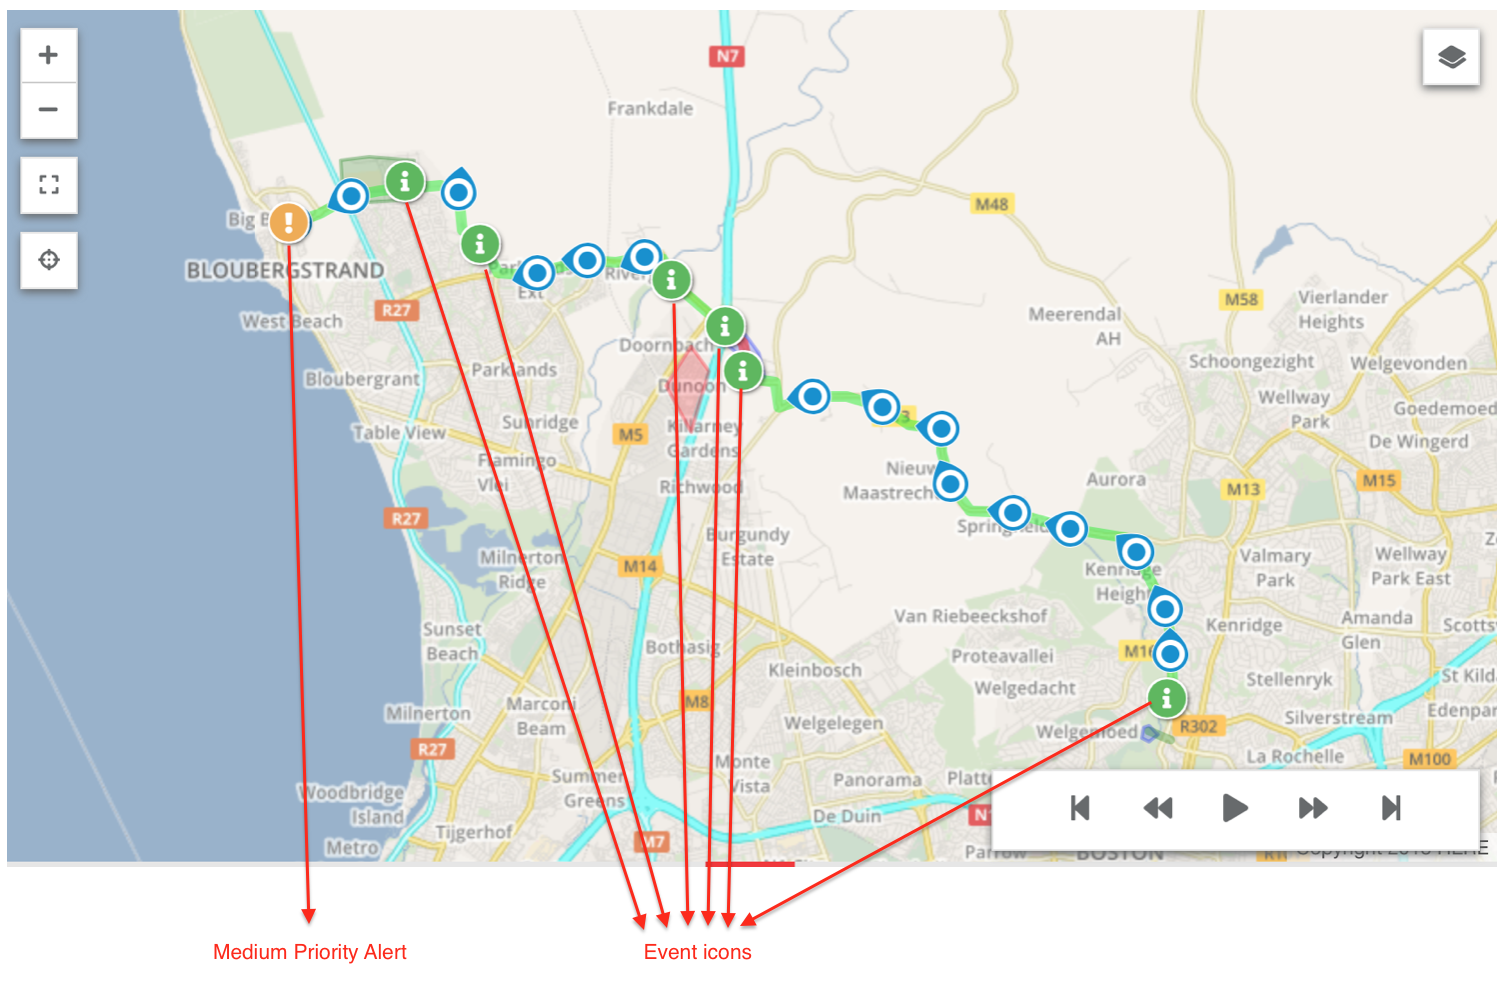
When a trip is displayed, icons appear on the map, in the position of a specific Event. If an Event has been used to create an Alert, the Alert will display as an icon as well:
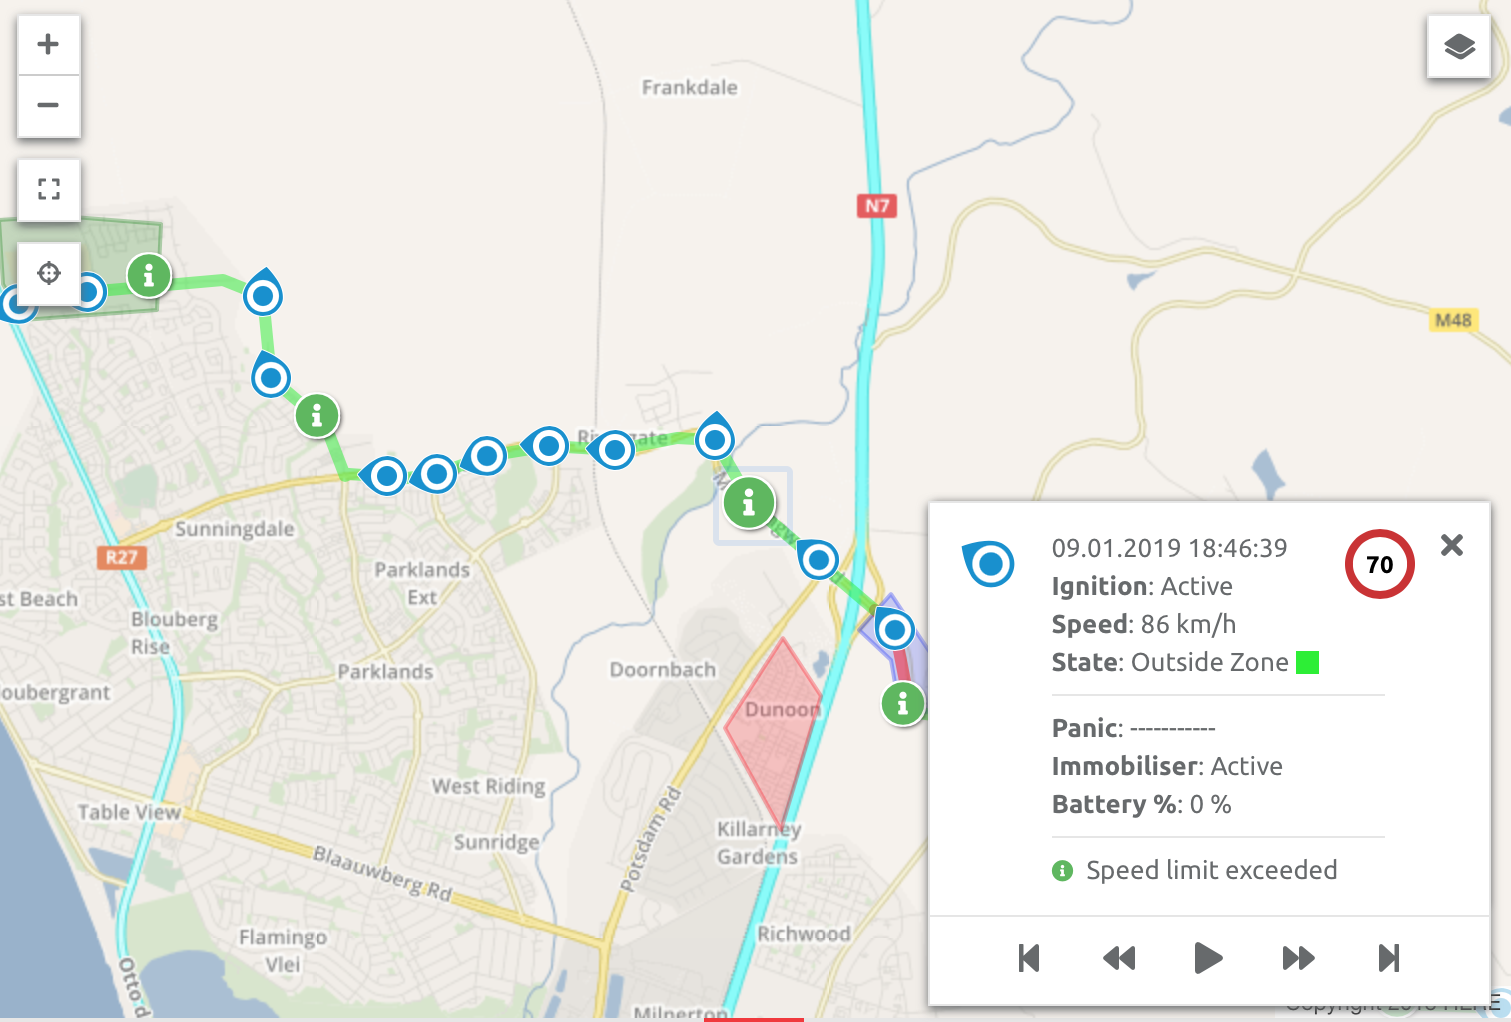
Clicking an Event icon generates a pop up with the information for that data point:
Listed Events
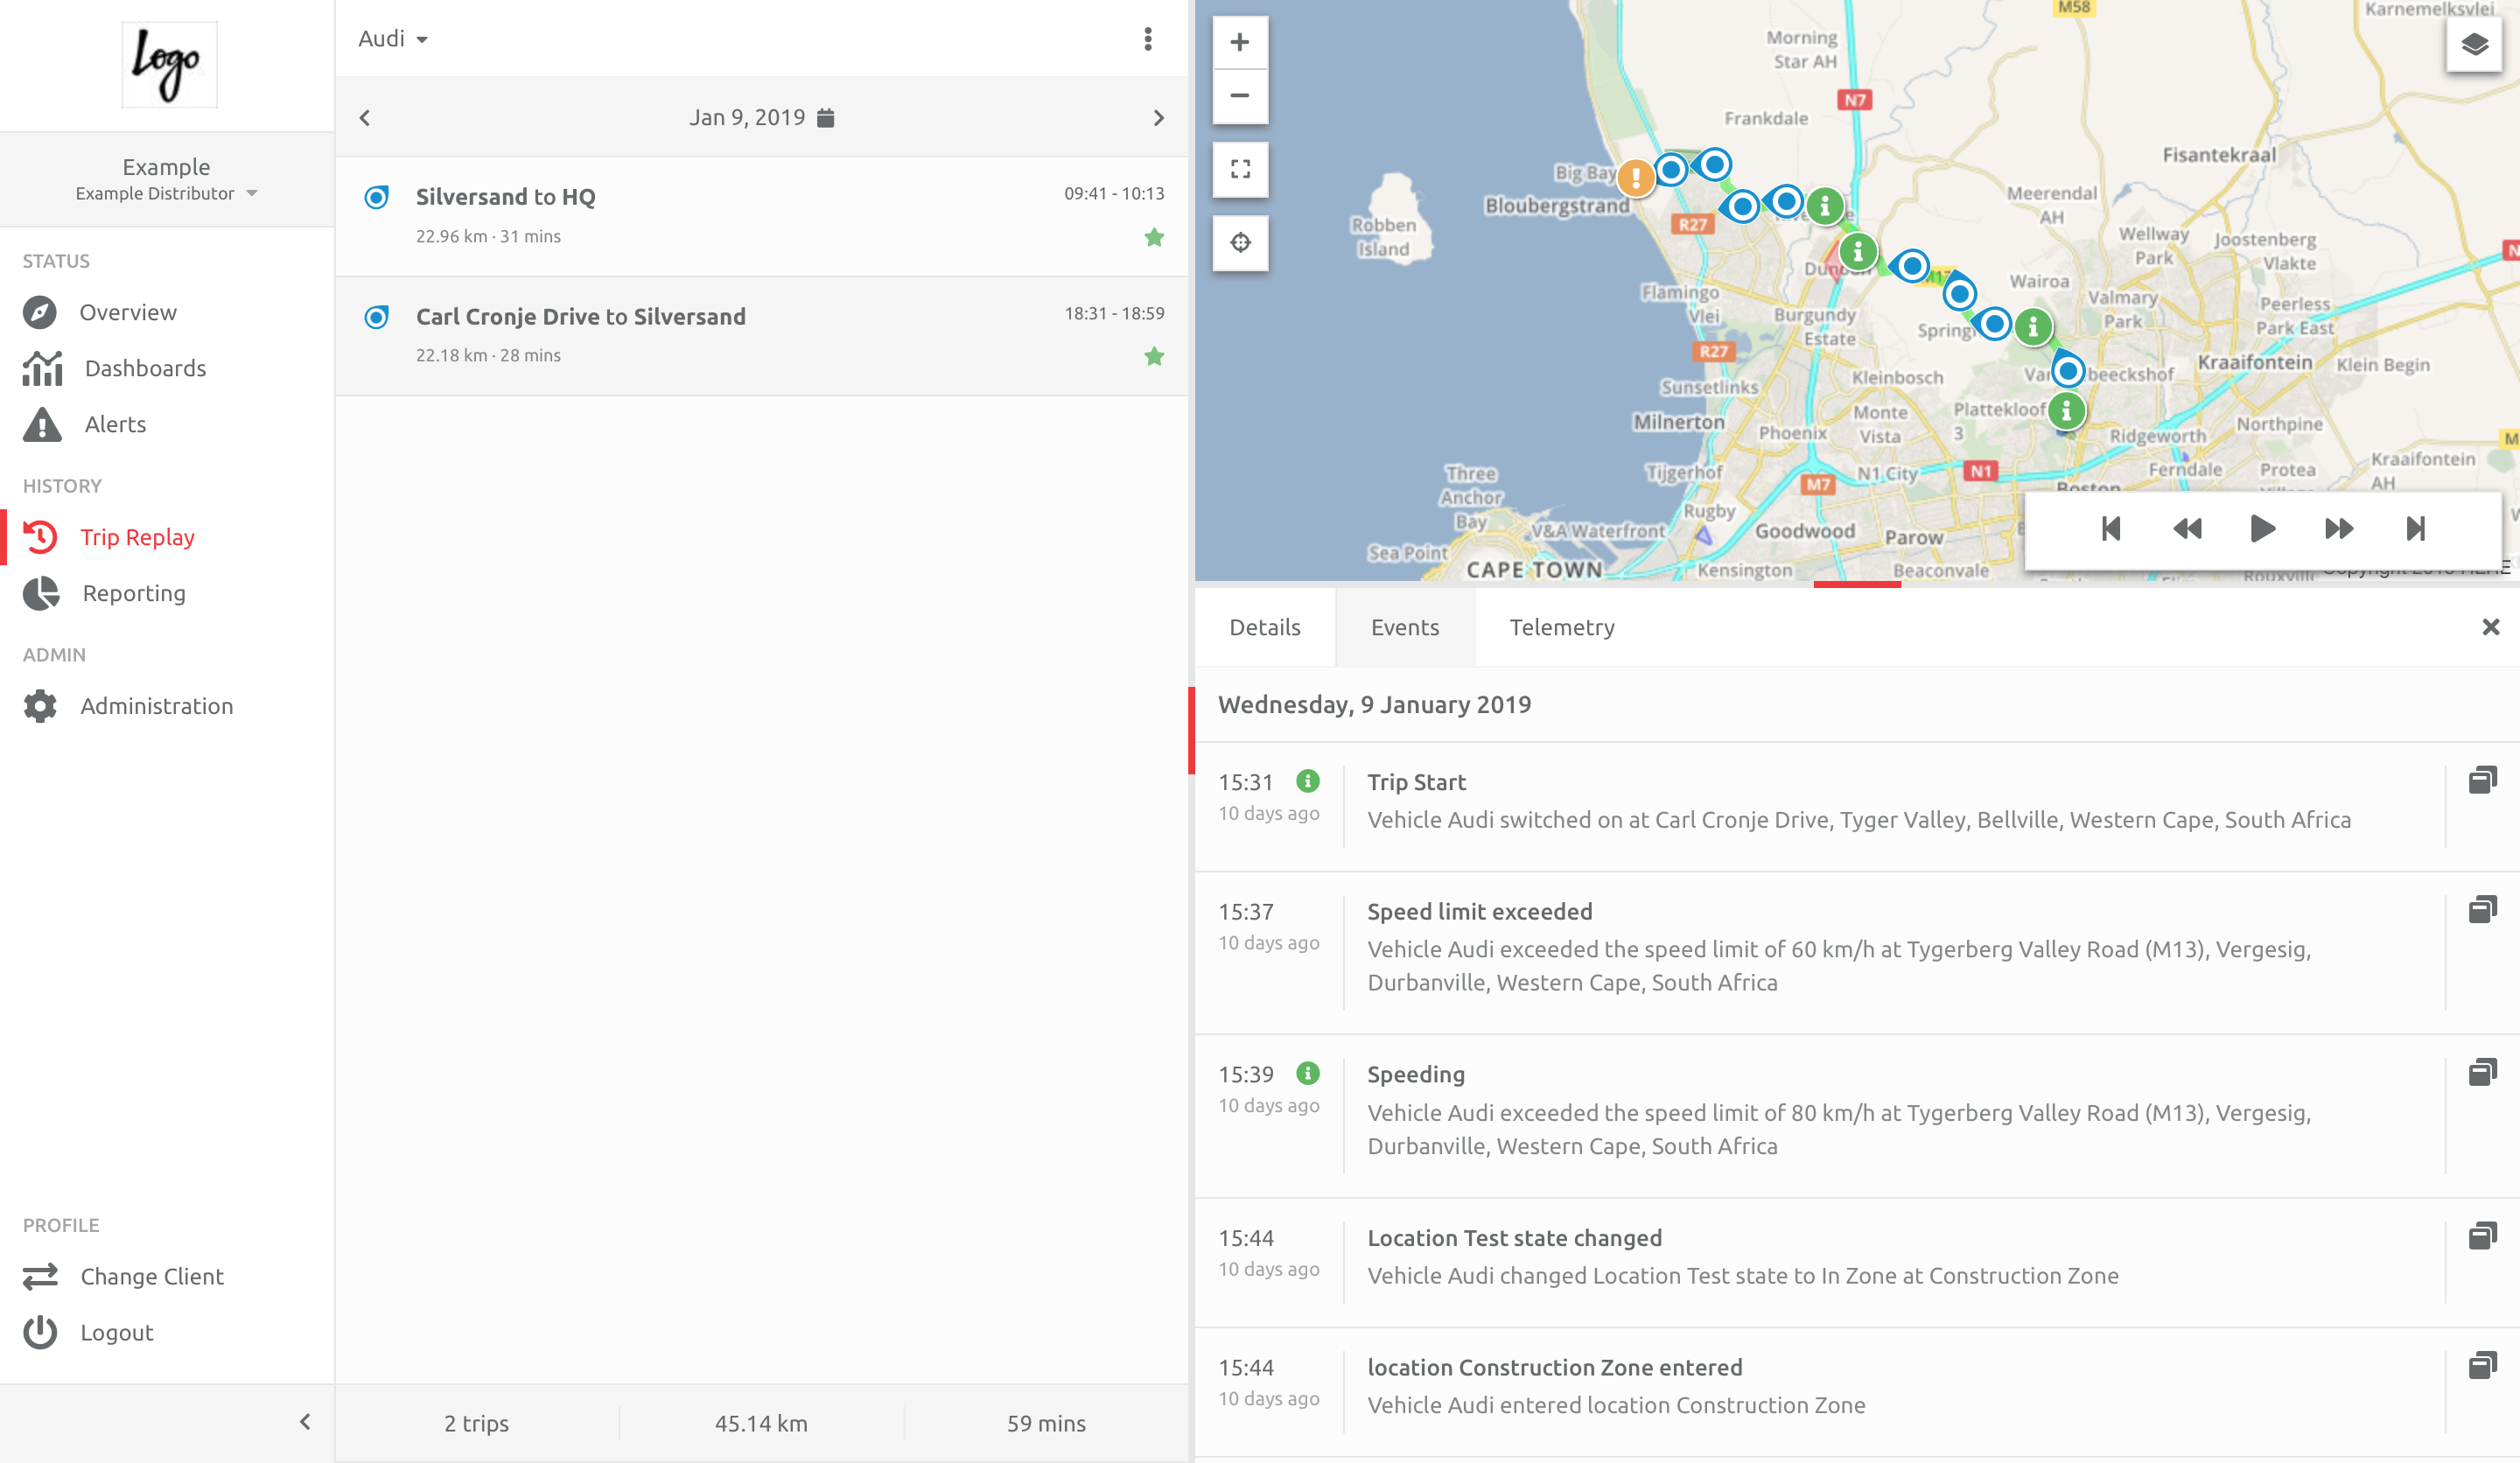
The Events for a trip are also displayed in a list, under the Events tab:
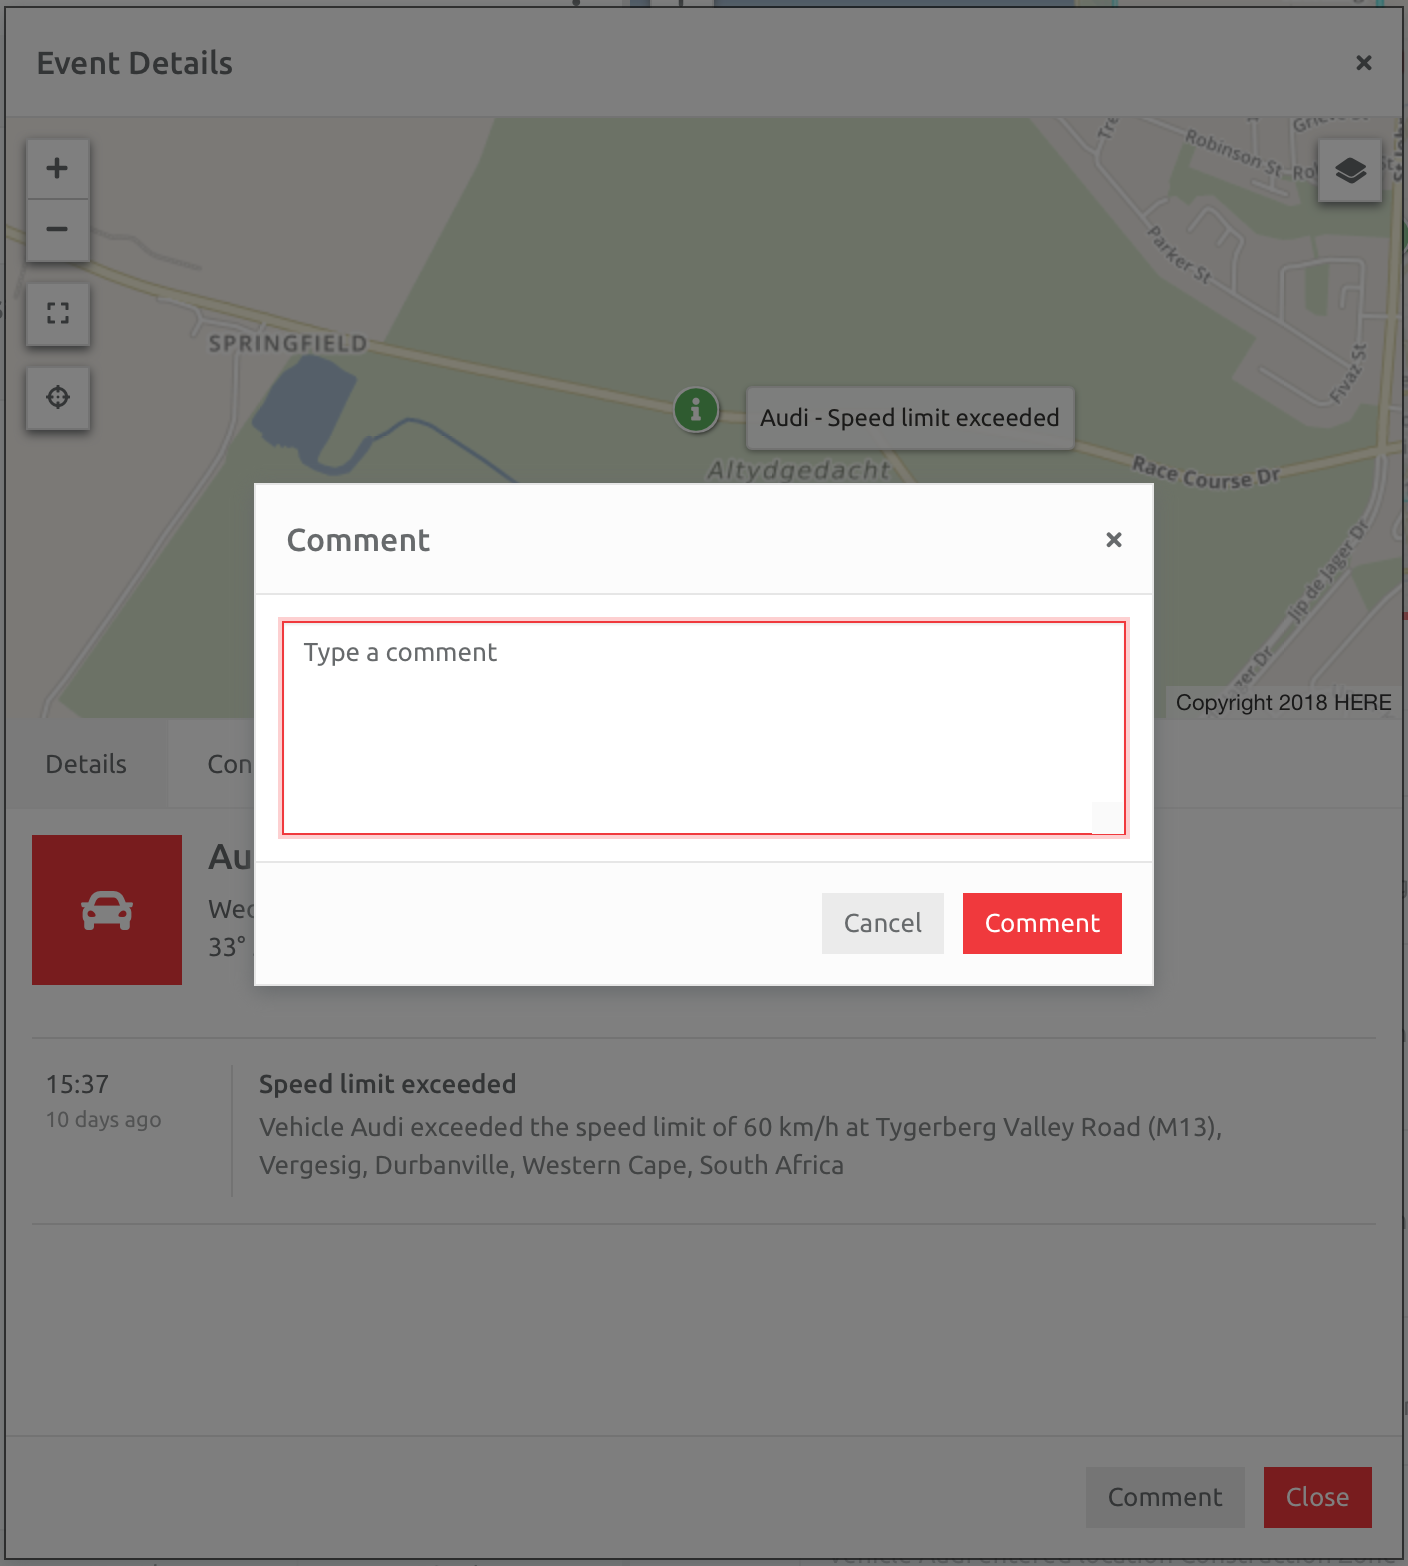
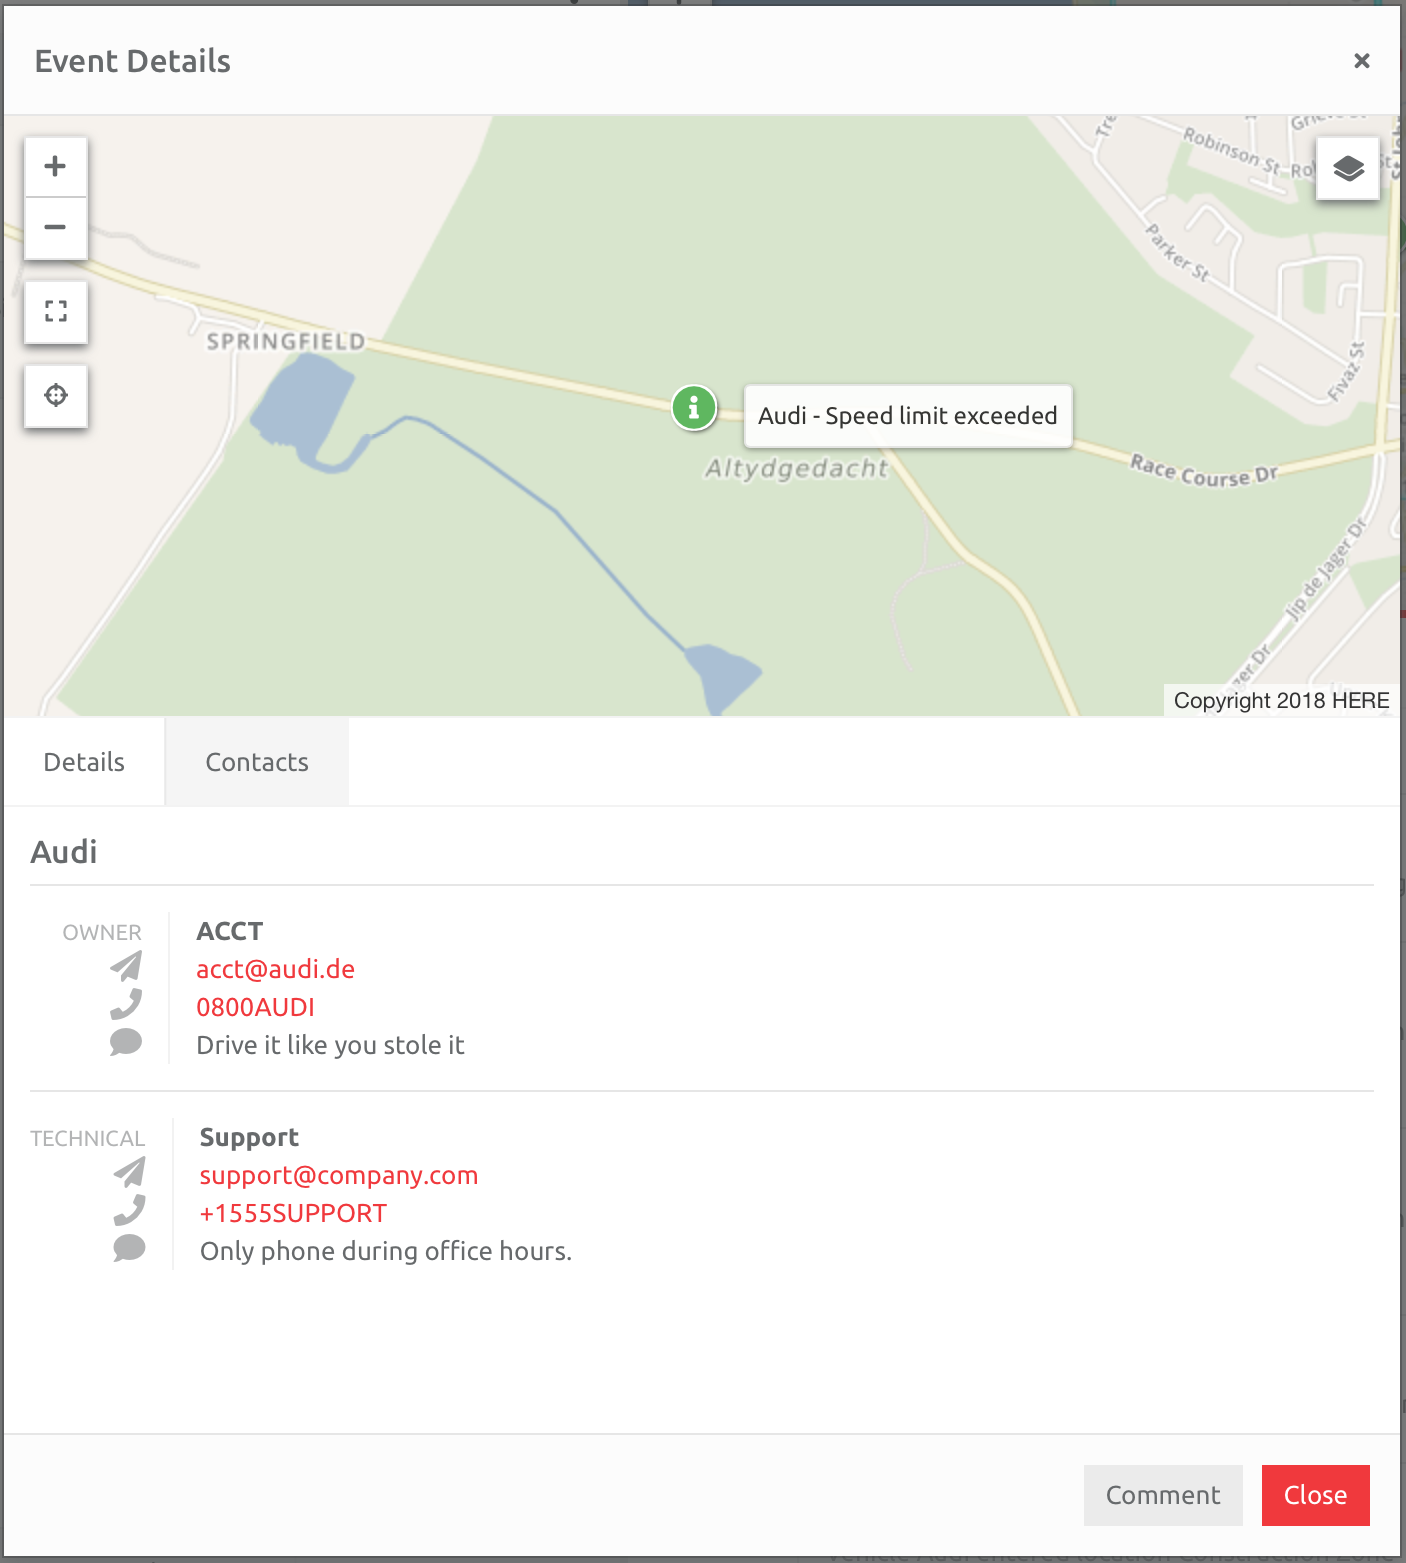
Clicking the Open a new pop-up window icon shows the Event in isolation on the map:
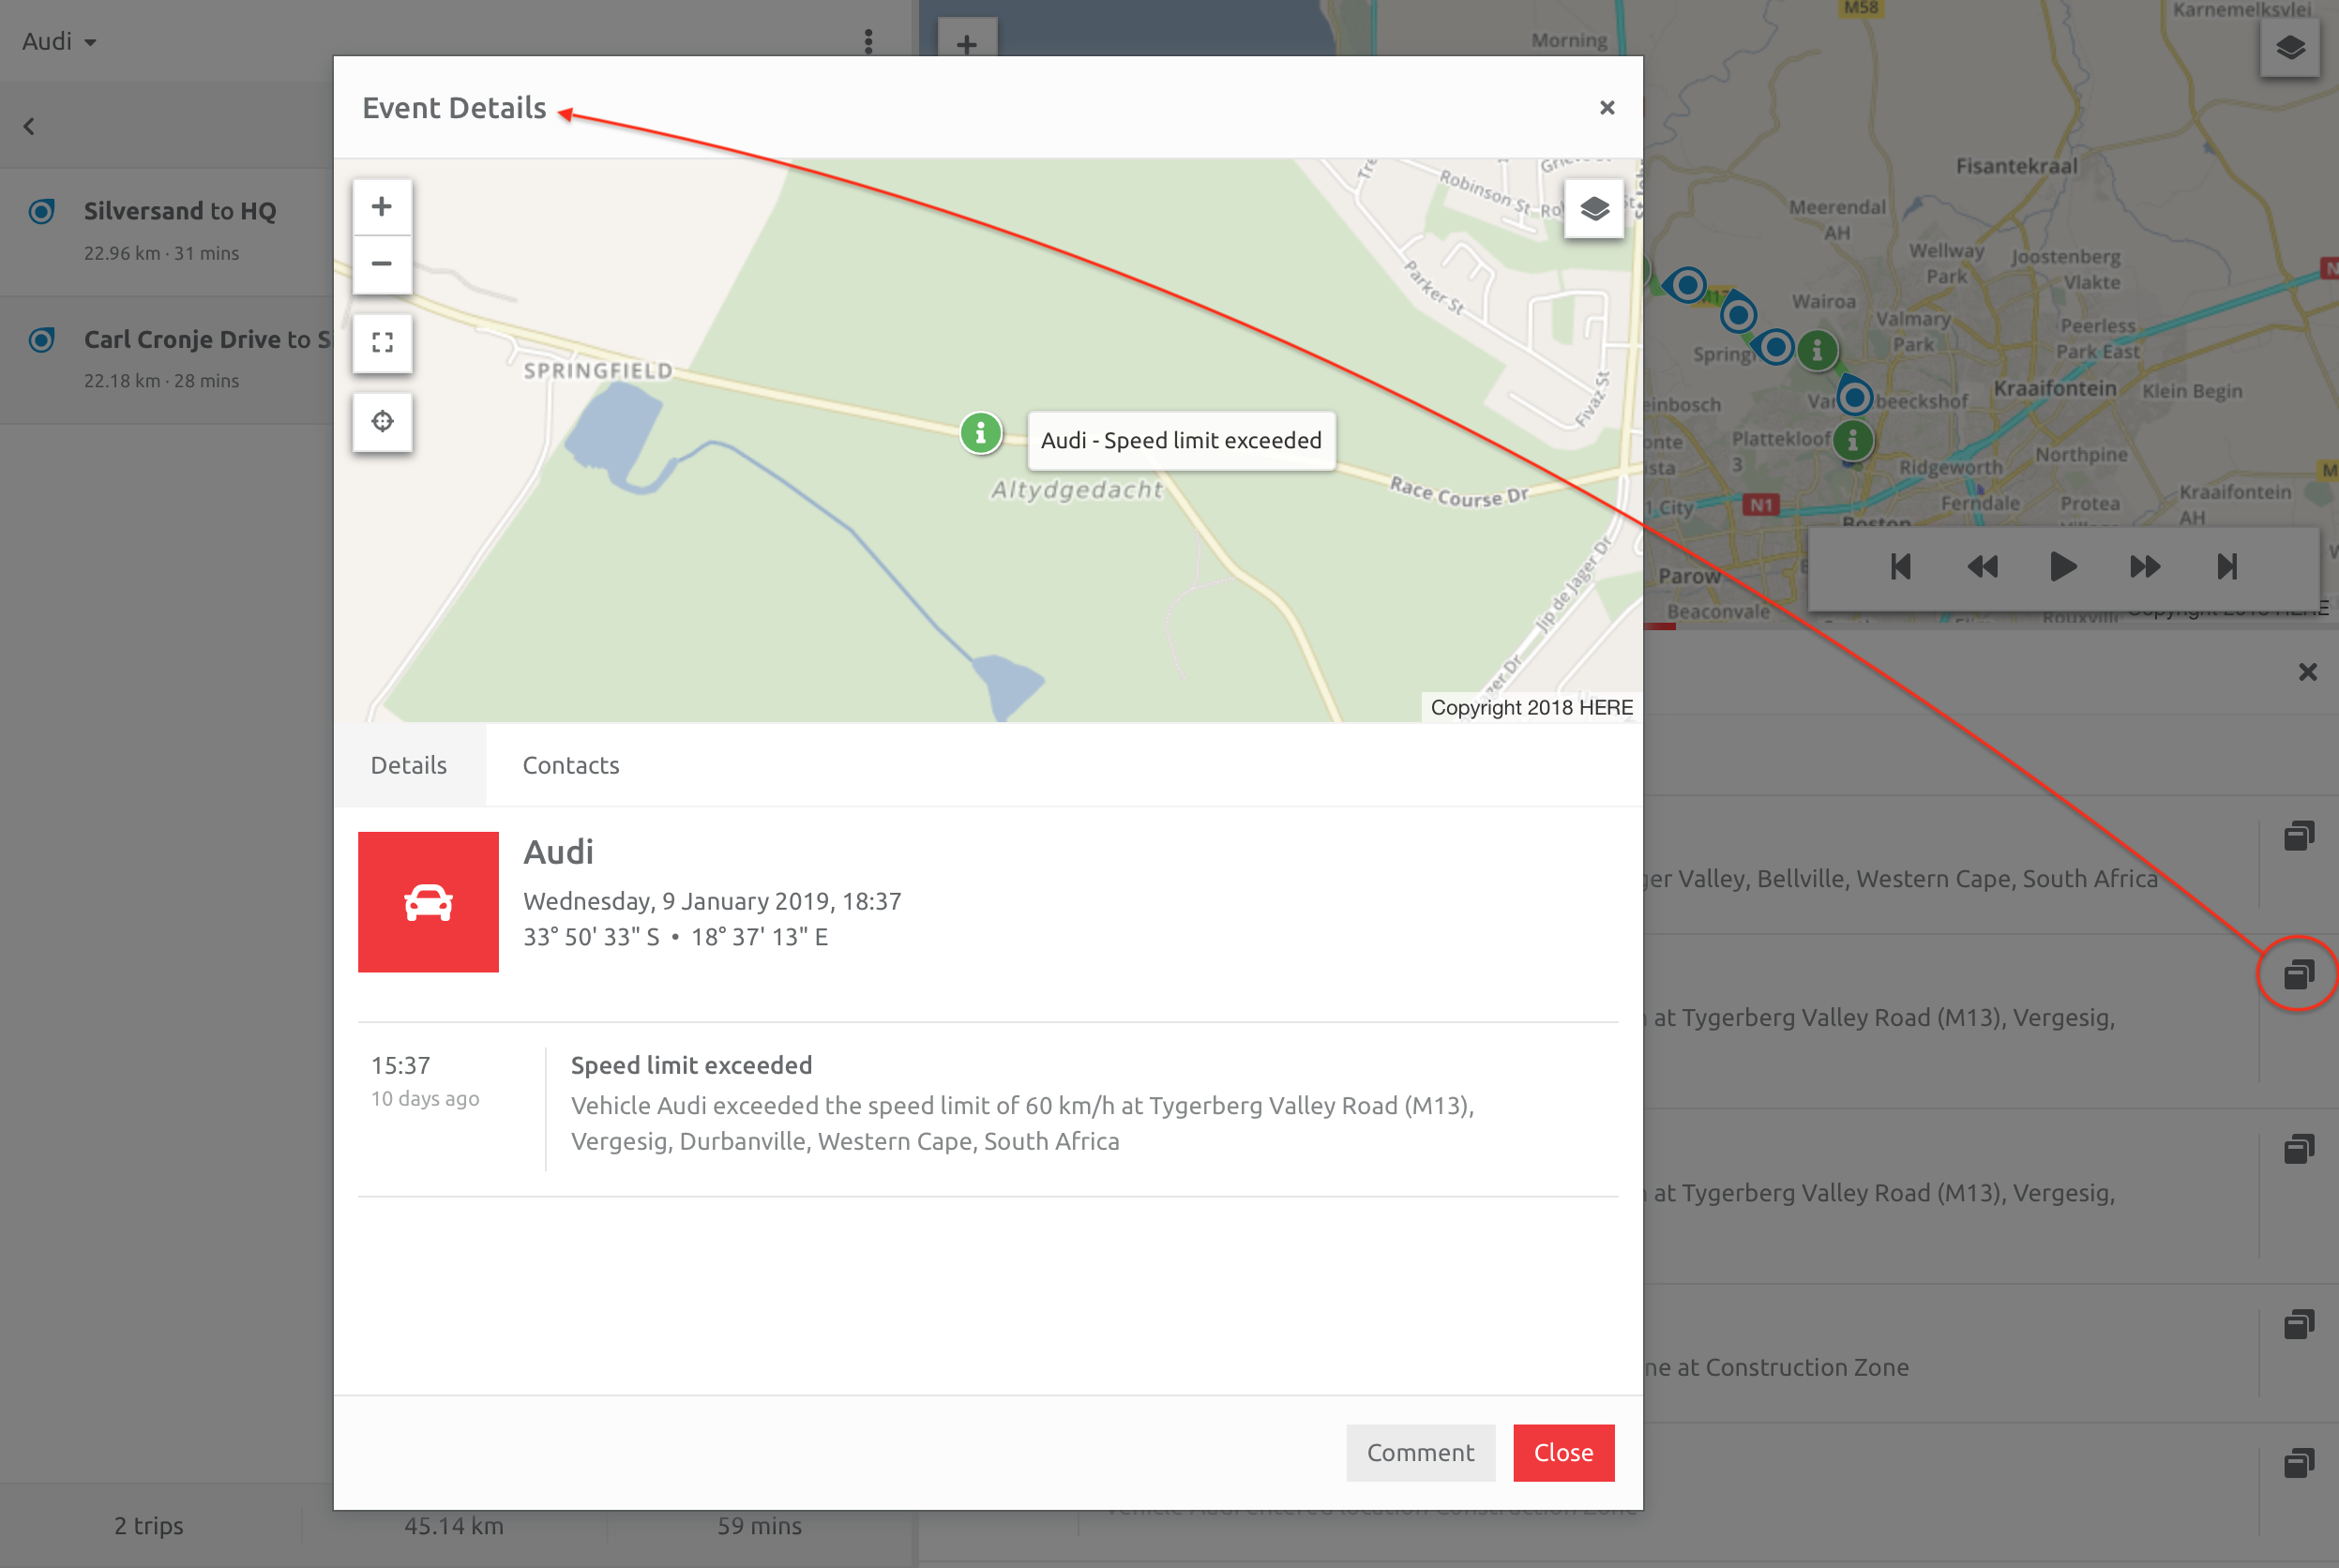
Users can comment on the Event, or check the Contacts for the Asset in question if needs be.
Reporting
There are numerous reports that can be generated from Events, specific to an Asset, a day, or multiple Assets and days:
1. Alert Report - lists Alerts generated from Events
2. Events Report - lists Assets and Events that have occurred,
3. Overspeeding - specifically shows overspeeding Events,
3. Excessive Idling - reports on excessive idling Events,
4. Digital Events - reports on any instances where the digital inputs have been triggered,
Comments
0 comments
Please sign in to leave a comment.